Retail traders ka sabse bada problem kya hai? Woh entry late lete hain — jab market move already ho chuka hota hai. Aur kyun hota hai aisa? Kyunki unhe pata hi nahi hota ki smart money kaise liquidity collect karta hai ek candle ke andar.
Aaj hum baat karenge CRT — Candle Range Theory ke ek powerful concept ki, jo tumhare trading ko fundamentally change kar sakta hai. Isme samjhenge Buy Side Liquidity Sweep aur Sell Side Liquidity Sweep dono — aur kaise yeh dono milke ek high-probability entry setup banate hain.
CRT Kya Hai? (Candle Range Theory Explained)
CRT (Candle Range Theory) ek multi-timeframe (MTF) concept hai jisme ek Higher Timeframe (HTF) candle ko uske Lower Timeframe (LTF) candles mein tod ke dekha jaata hai — taaki yeh samjha ja sake ki:
- Price ne kahan liquidity sweep ki
- Market ne displacement kahan liya
- Entry point kahan banta hai
Simple example:
Ek 30-minute candle = Do 15-minute candles ka combination
Jab hum 30m candle ke andar 15m candles ko dekhaate hain, toh price ka actual manipulation aur smart money ka move clearly dikh jaata hai.
Visual Structure Ko Samjho
CRT chart mein teen main visual elements hote hain:
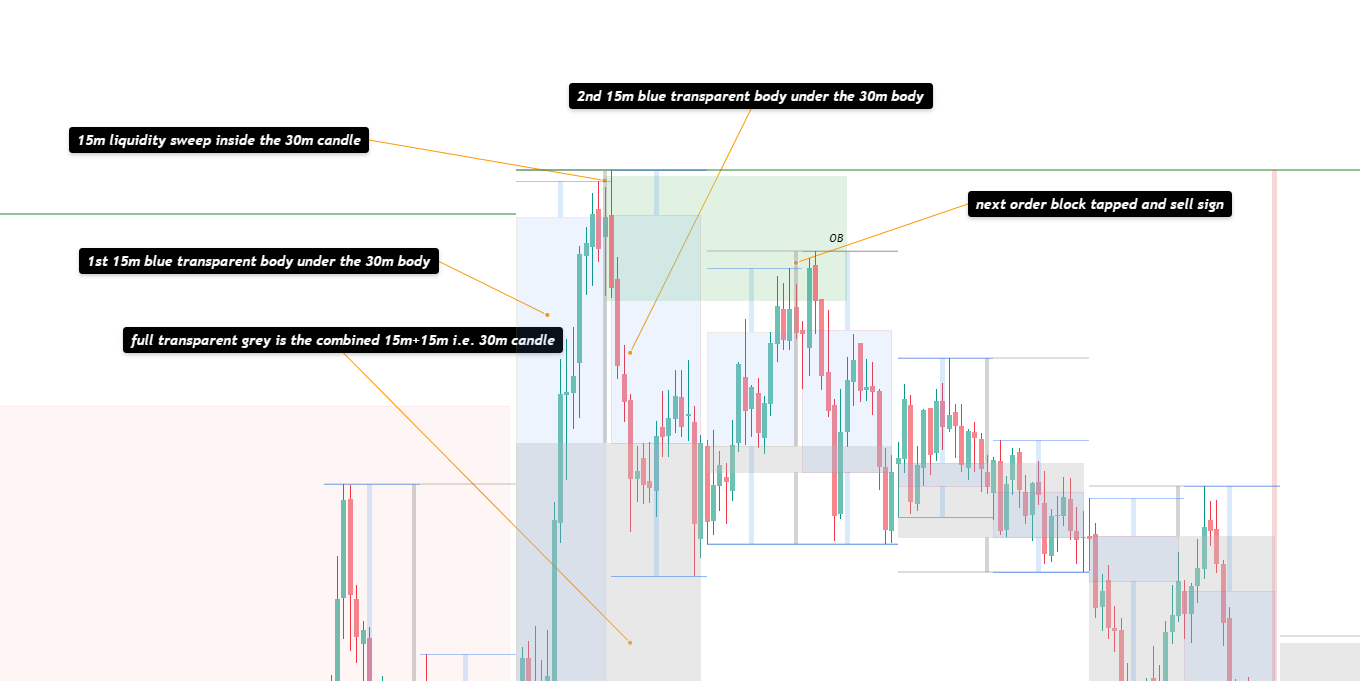
🔲 1. Full Transparent Grey Box — 30m Candle Range
Yeh box represent karta hai combined 30m candle ka poora range — High se Low tak. Dono 15m candles milke is range ko banaate hain.
🔵 2. Blue Transparent Bodies — 15m Candles
- 1st Blue Body = Pehla 15m candle ka body
- 2nd Blue Body = Doosra 15m candle ka body
Dono blue bodies 30m body ke andar ya uske relative position mein hote hain — jisse pata chalta hai ki sweep oopar hua ya neeche.
🟢 3. Green Zone = Order Block (OB)
Jahan smart money ne orders place kiye hain. Price is zone mein wapas aata hai — aur wahi se entry milti hai.
Buy Side Liquidity Sweep Setup (Bearish CRT)
Yeh setup short/sell entry ke liye hota hai.
Step-by-Step Breakdown:
Step 1 — Buy Side Liquidity Sweep (15m ke andar) Price 30m candle ke High ke upar jaata hai — wahan baitha hua Buy Side Liquidity (previous highs ke upar ke stop losses) sweep ho jaati hai. Yeh 15m candle ke wick se hota hai.
Step 2 — 1st 15m Body 30m Body ke Neeche Close Sweep ke baad, pehla 15m candle bearishly close karta hai — aur uska body 30m candle body ke neeche banta hai. Yeh pehla sign hai ki smart money ne buy side collect karke sell side pe push karna start kar diya.
Step 3 — 2nd 15m Body Bhi Neeche Rehta Hai Doosra 15m candle bhi confirm karta hai ki price 30m body ke neeche hai. Iska matlab: bearish displacement confirmed.
Step 4 — Pullback to Order Block (OB) Displacement ke baad price ek bearish Order Block ya premium zone mein wapas aata hai.
Step 5 — Sell Signal Trigger OB tap hone ke baad signal candle milta hai — aur yahi short/sell entry ka point hota hai.
📊 Summary Table — Buy Side Sweep (Bearish Setup)
| Step | Price Action | Meaning |
|---|---|---|
| 1 | 30m High ke upar wick | Buy side liquidity swept |
| 2 | 1st 15m body 30m body ke neeche | Bearish momentum start |
| 3 | 2nd 15m body bhi neeche | Displacement confirmed |
| 4 | OB zone mein pullback | Re-test of supply |
| 5 | Sell signal | Entry point |
Sell Side Liquidity Sweep Setup (Bullish CRT)
Yeh setup long/buy entry ke liye hota hai — bilkul mirror image hai bearish CRT ka.
Step-by-Step Breakdown:
Step 1 — Sell Side Liquidity Sweep (15m ke andar) Price 30m candle ke Low ke neeche jaata hai — wahan baitha hua Sell Side Liquidity (previous lows ke neeche ke stop losses) sweep ho jaati hai. Yeh 15m candle ke lower wick se hota hai.
Step 2 — 1st 15m Body 30m Body ke Upar Close Sweep ke baad, pehla 15m candle bullishly close karta hai — body 30m body ke upar banta hai. Smart money ne sell side collect karke buy side push karna start kar diya.
Step 3 — 2nd 15m Body Bhi Upar Rehta Hai Doosra 15m candle confirm karta hai ki price 30m body ke upar hai. Bullish displacement confirmed.
Step 4 — Pullback to Order Block (OB) / Demand Zone Price ek bullish Order Block ya discount zone mein wapas aata hai for re-test.
Step 5 — Buy Signal Trigger OB tap + signal candle milta hai — yahi long/buy entry ka point hota hai.
📊 Summary Table — Sell Side Sweep (Bullish Setup)
| Step | Price Action | Meaning |
|---|---|---|
| 1 | 30m Low ke neeche wick | Sell side liquidity swept |
| 2 | 1st 15m body 30m body ke upar | Bullish momentum start |
| 3 | 2nd 15m body bhi upar | Displacement confirmed |
| 4 | OB zone mein pullback | Re-test of demand |
| 5 | Buy signal | Entry point |
Dono Setups Ka Core Logic — Ek Nazar Mein
| Feature | Bearish CRT | Bullish CRT |
|---|---|---|
| Liquidity Type | Buy Side (SSL above highs) | Sell Side (BSL below lows) |
| Sweep Direction | Upar wick | Neeche wick |
| 15m Bodies Position | 30m body ke neeche | 30m body ke upar |
| Trade Type | Sell / Short | Buy / Long |
| OB Type | Bearish / Supply OB | Bullish / Demand OB |
| Signal | Sell sign at OB | Buy sign at OB |
Yeh Setup Gold (XAUUSD) Mein Kyun Itna Effective Hai?
Gold ek highly manipulated market hai. Institutional players daily intraday mein:
- Retail traders ke stop losses hunt karte hain
- Liquidity pools create aur destroy karte hain
- Candle wicks ke through false moves create karte hain
CRT exactly yahi capture karta hai — woh manipulation jo ek single 30m candle ke andar hoti hai, lekin 15m timeframe pe clearly visible hoti hai.
Gold mein yeh setup London session aur NY session open ke time pe best work karta hai, kyunki tab institutional volume sabse zyada hota hai.
Common Mistakes Jo Retail Traders Karte Hain
❌ Galti 1: Sweep ke turant baad entry lena Sweep hona kafi nahi hai. Wait karo displacement ke liye — dono 15m bodies ka ek side pe close hona zaroori hai.
❌ Galti 2: Order Block ko ignore karna Bina OB confirmation ke entry lena ek random entry hai. Always wait for OB tap + signal candle.
❌ Galti 3: 30m candle ka range identify karna galat karna Grey box sahi hona chahiye — poora 30m range cover karna chahiye, sirf body nahi.
❌ Galti 4: Higher Timeframe Bias ke bina entry lena Agar HTF (4H ya Daily) bullish hai, toh sirf bullish CRT setups lo. Trend ke against CRT setups ka success rate kam hota hai.
Entry Checklist — STR Style
Koi bhi CRT trade lene se pehle yeh checklist follow karo:
✅ HTF bias confirm hai (bullish ya bearish)?
✅ 30m candle ka grey range box identify kiya?
✅ 15m liquidity sweep clearly visible hai (wick out of range)?
✅ Dono 15m bodies sweep ke opposite side close hue?
✅ OB/Demand-Supply zone identify kiya?
✅ OB tap hua aur signal candle mila?
✅ Stop Loss sweep ke baad ke wick ke peeche set hai?
✅ Risk:Reward minimum 1:2 hai?
Real Trade Example — XAUUSD Bearish CRT
Scenario:
- HTF (4H): Bearish — price distribution zone mein
- 30m: Ek bullish candle bana jo previous high ke paas tha
- 15m decomposition: Pehle 15m candle ne high sweep kiya, dono 15m bodies 30m body ke neeche close hue
- Price ne bearish OB pe pullback liya
- Signal candle mila — Sell entry triggered
Trade Details:
- Entry: OB high pe (approx. 2685.00)
- Stop Loss: Sweep wick ke upar (approx. 2688.50)
- Target: Next liquidity level (approx. 2672.00)
- Risk:Reward: 1:3.7
Result: Price ne OB se directly sell off kiya — clean trade. ✅
Conclusion — CRT Se Trading Ko Next Level Pe Le Jaao
CRT (Candle Range Theory) ek aisa tool hai jo retail traders ko woh edge deta hai jo usually sirf institutional traders ke paas hoti hai. Jab tum ek 30m candle ko 15m candles mein todke dekho, toh manipulation clearly dikh jaata hai — aur tum smart money ke saath trade kar sakte ho, unke against nahi.
Key takeaways:
- Buy Side Sweep = Bearish setup → Sell entry
- Sell Side Sweep = Bullish setup → Buy entry
- Order Block + Signal Candle = Entry trigger
- HTF bias hamesha confirm karo pehle
Agar yeh concept naya laga hai, toh is article ko save karo aur dobara padho — kyunki CRT ek baar samajh aaya, toh chart completely alag dikhne lagta hai.
❓ FAQs
Q1: CRT sirf Gold ke liye hai ya aur instruments mein bhi kaam karta hai? CRT kisi bhi liquid market mein kaam karta hai — Forex pairs (EURUSD, GBPUSD), indices (NAS100), aur crypto mein bhi. Lekin Gold (XAUUSD) mein yeh sabse clean setup deta hai.
Q2: Kaunsa timeframe best hai CRT ke liye? Most effective combination: 30m HTF + 15m LTF. Lekin 1H+30m ya 4H+1H bhi use ho sakta hai depending on trading style.
Q3: Kya CRT bina Order Block ke kaam karta hai? Technically sweep aur displacement ke baad entry li ja sakti hai, lekin OB hone par trade ka R:R aur accuracy dono improve hote hain.
Q4: CRT aur ICT concepts mein kya connection hai? CRT essentially ICT ke concepts — liquidity sweeps, displacement, order blocks — ko ek structured candle-based framework mein apply karta hai. Agar ICT jaante ho, CRT bahut quickly samajh aayega.
Q5: Kitna practice chahiye CRT master karne ke liye? Minimum 50-100 historical setups backtest karo — pehle identify karna seekho, phir entries practice karo. Aur paper trade karo live market mein 2-4 weeks before going live.
For more content, you can check here.
You can follow my social platforms here.
700+ YouTube content. You can subscribe to more live content here.
2200+ Twitter postings on live proof here.
Follow the Facebook page for updates.
Disclaimer: Yeh content sirf educational purpose ke liye hai. Trading mein risk hota hai. Apna khud ka research karein.