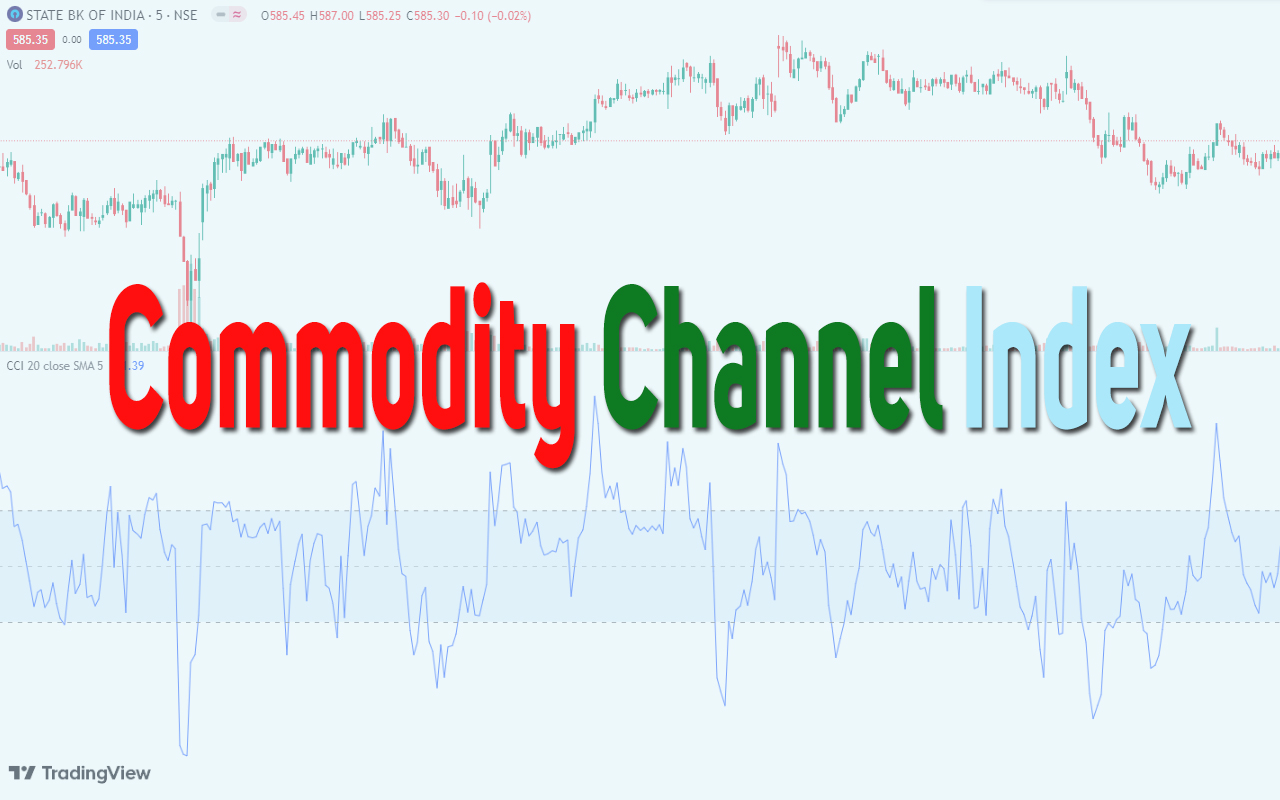
CCI, or Commodity Channel Index, is a technical analysis indicator that is used to determine whether a security is overbought or oversold. It was developed by Donald Lambert and is typically used to identify cyclical turns in commodities, currencies, and other securities. The Commodity Channel Index, commonly known as CCI, is a versatile technical analysis tool developed by Donald Lambert in 1980. CCI measures the current price level relative to an average price level over a specified period. It is primarily used to identify overbought and oversold levels in a particular security or market.
It is commonly used in the stock market and other financial markets such as commodities and currencies.
CCI / Commodity Channel Index measure
CCI measures the deviation of a security’s price from its statistical average. It compares the current price to the average price over a certain period, such as 20 or 50 days. If the current price is significantly higher or lower than the average price, it may indicate that the security is overbought or oversold, respectively.
Range of CCI / Commodity Channel Index Indicator
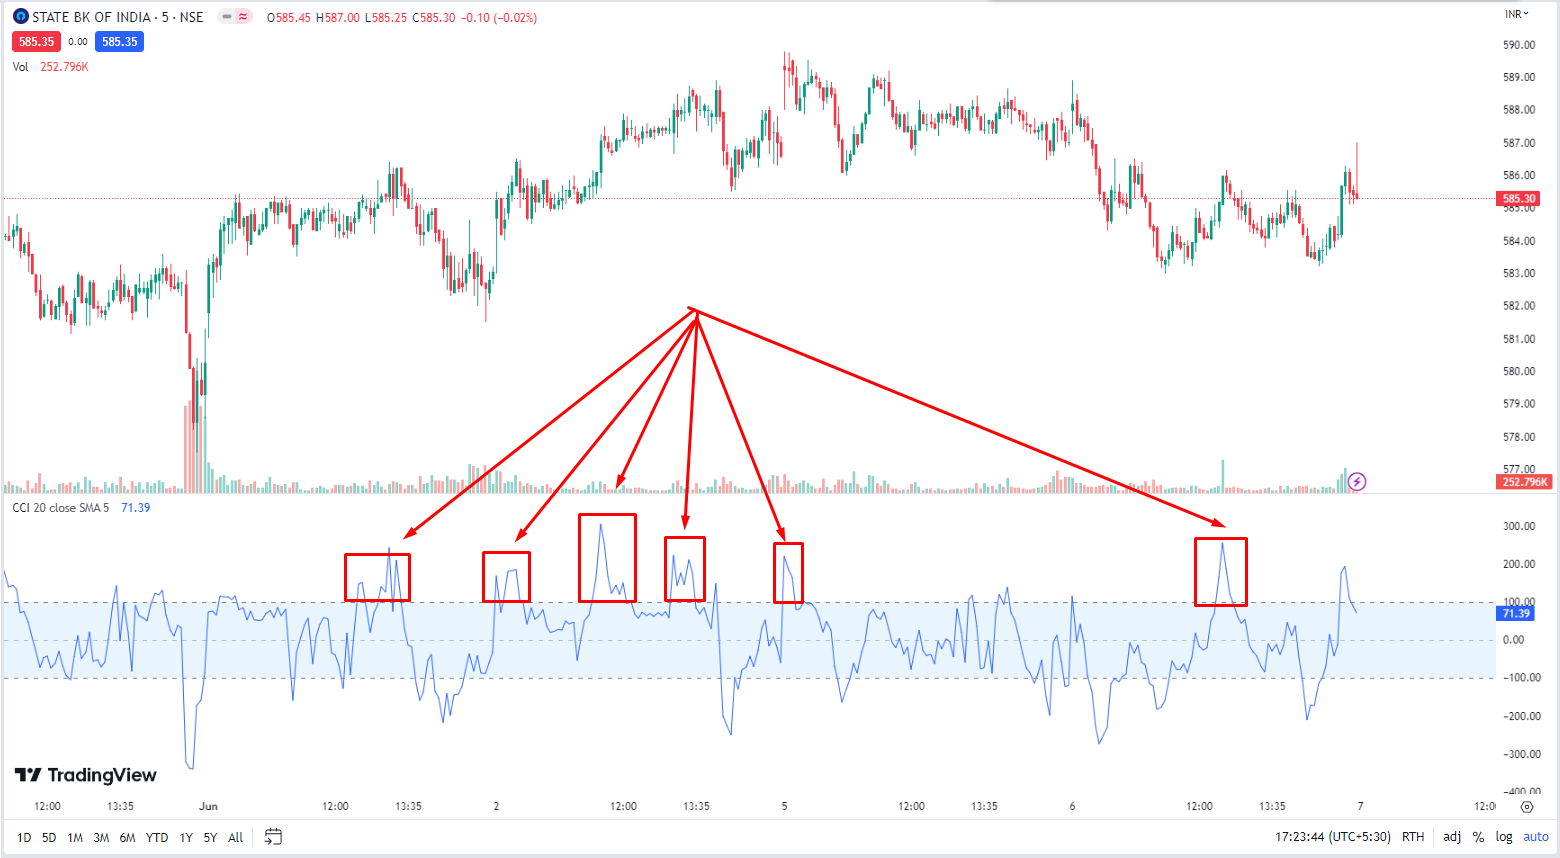
Overbought:
When the CCI value exceeds a predefined threshold, typically +100, it suggests that the market or security is overbought. This indicates a potential downward price correction or trend reversal. Traders might consider selling or taking profits in such scenarios.
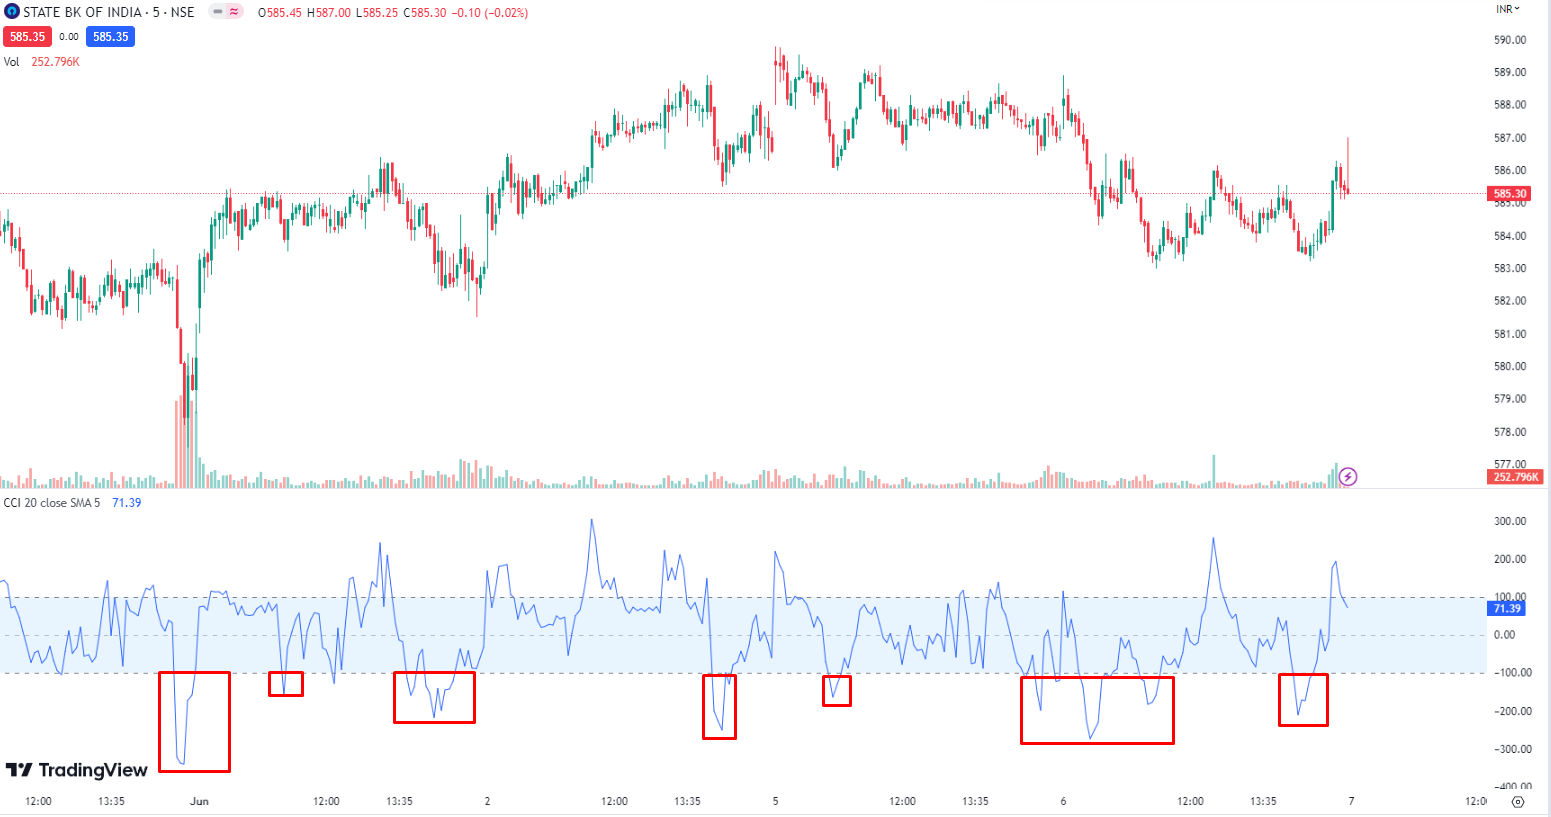
Oversold:
Conversely, when the CCI value falls below a predefined threshold, usually -100, it indicates that the market or security is oversold. This implies a possible upward price correction or trend reversal. Traders might consider buying or entering long positions when oversold conditions occur.
Divergence:
CCI divergence occurs when the price action of security disagrees with the corresponding CCI reading. Bullish divergence happens when the price forms lower lows while the CCI forms higher lows, indicating a potential upward reversal. On the other hand, a bearish divergence occurs when the price forms higher highs while the CCI forms lower highs, suggesting a potential downward reversal.
Where to use Commodity Channel Index Indicator
As we step into 2023, the stock market continues to be influenced by a multitude of factors, including global events, economic indicators, and investor sentiment. When incorporating CCI into stock market analysis, it is essential to consider it as one piece of the puzzle.
a. Identifying Entry and Exit Points:
CCI can help traders identify favorable entry and exit points by detecting overbought and oversold levels. However, it is crucial to combine CCI analysis with other indicators, chart patterns, and fundamental analysis to validate signals and minimize false positives.
b. Confirming Trend Strength:
CCI can also be used to gauge the strength of an existing trend. When the CCI value remains consistently above zero, it indicates a strong uptrend, while values below zero suggest a strong downtrend. Traders can leverage this information to make decisions aligned with the prevailing trend.
c. Managing Risk:
CCI can assist in managing risk by providing insights into potential trend reversals. Traders can use CCI signals to adjust their positions, tighten stop-loss orders, or take profits to safeguard their
Meaning of Overbought & Oversold
CCI works on the stock market by providing traders and investors with an indication of when security may be overbought or oversold. When security is overbought, it means that it has been bought heavily by traders and investors and that its price may be temporarily inflated. When security is oversold, it means that it has been sold heavily by traders and investors and that its price may be temporarily depressed.
Using the Indicator
To use CCI on the stock market, traders and investors typically plot the indicator on a chart along with the security price they are analyzing. They may then look for extreme values of CCI (above +100 or below -100) as potential signals to buy or sell the security. For example, if CCI is showing a value below -100, traders and investors may interpret this as a signal to buy the security, as it is considered oversold.
General Guidelines
Here are some general guidelines for interpreting the CCI on the stock market:
- Values above +100: This may indicate that the security is overbought and that its price may be temporarily inflated. Traders and investors may interpret this as a potential sell signal.
- Values below -100: This may indicate that the security is oversold and that its price may be temporarily depressed. Traders and investors may interpret this as a potential buy signal.
- Values between -100 and +100: This may indicate that the security is trading within a normal range and that its price is not significantly inflated or depressed.
Add Commodity Channel Index on the TradingView Platform
Adding the Commodity Channel Index (CCI) indicator to your TradingView platform is a straightforward process. Here’s a step-by-step guide to help you incorporate CCI into your trading analysis:
Open TradingView: Launch the TradingView website or app and log in to your account. For more on the Tradingview indicator, you can go through the section here.

Select a Chart: Choose a stock or market you want to analyze by entering the symbol or name in the search bar. Once you find the desired instrument, click on it to open the corresponding chart.
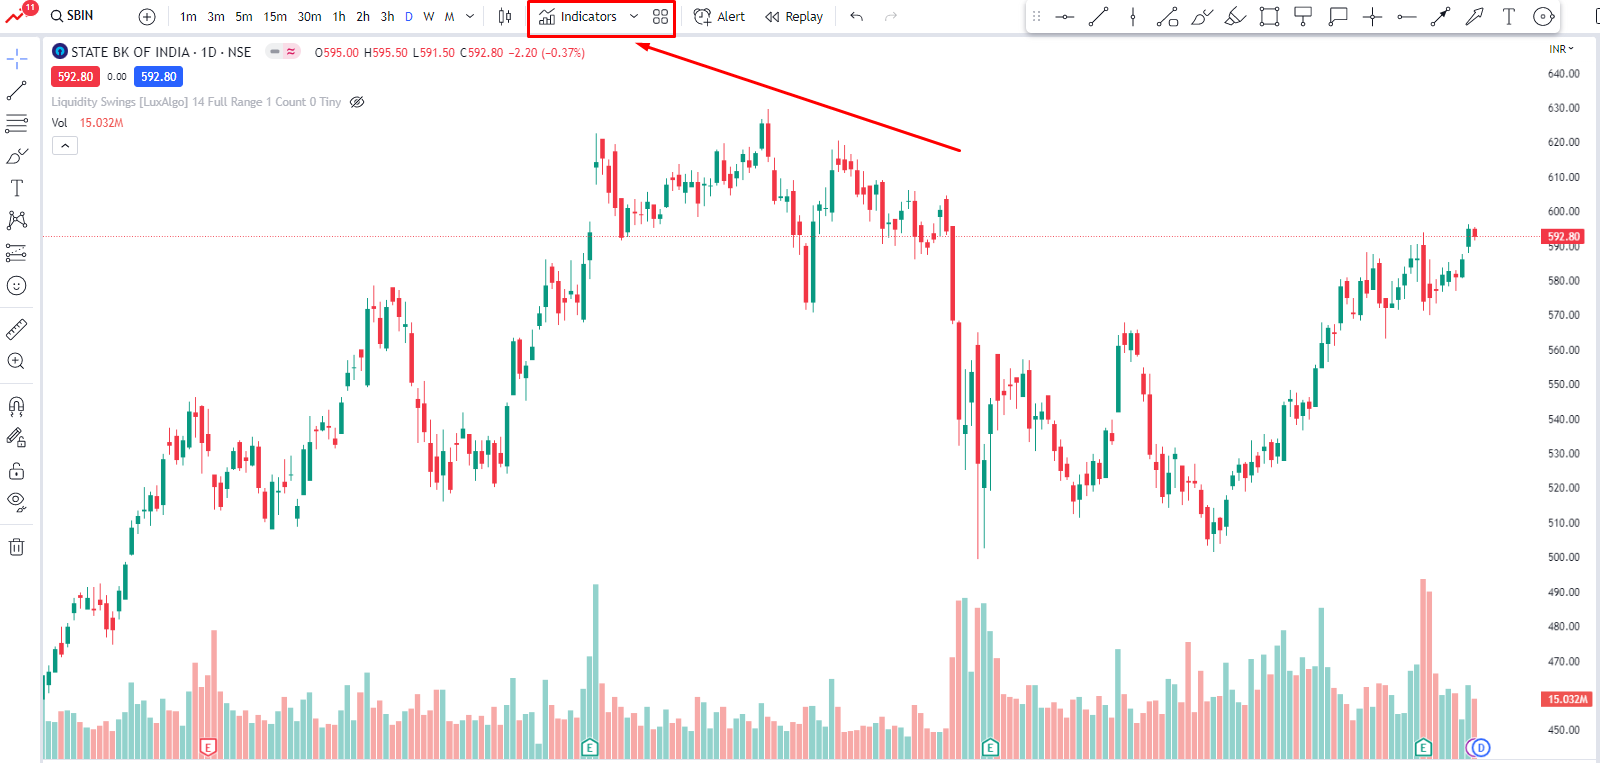
Open Indicators: Locate the toolbar at the top of the chart and click on the “Indicators” button. It is represented by a wave-like icon.
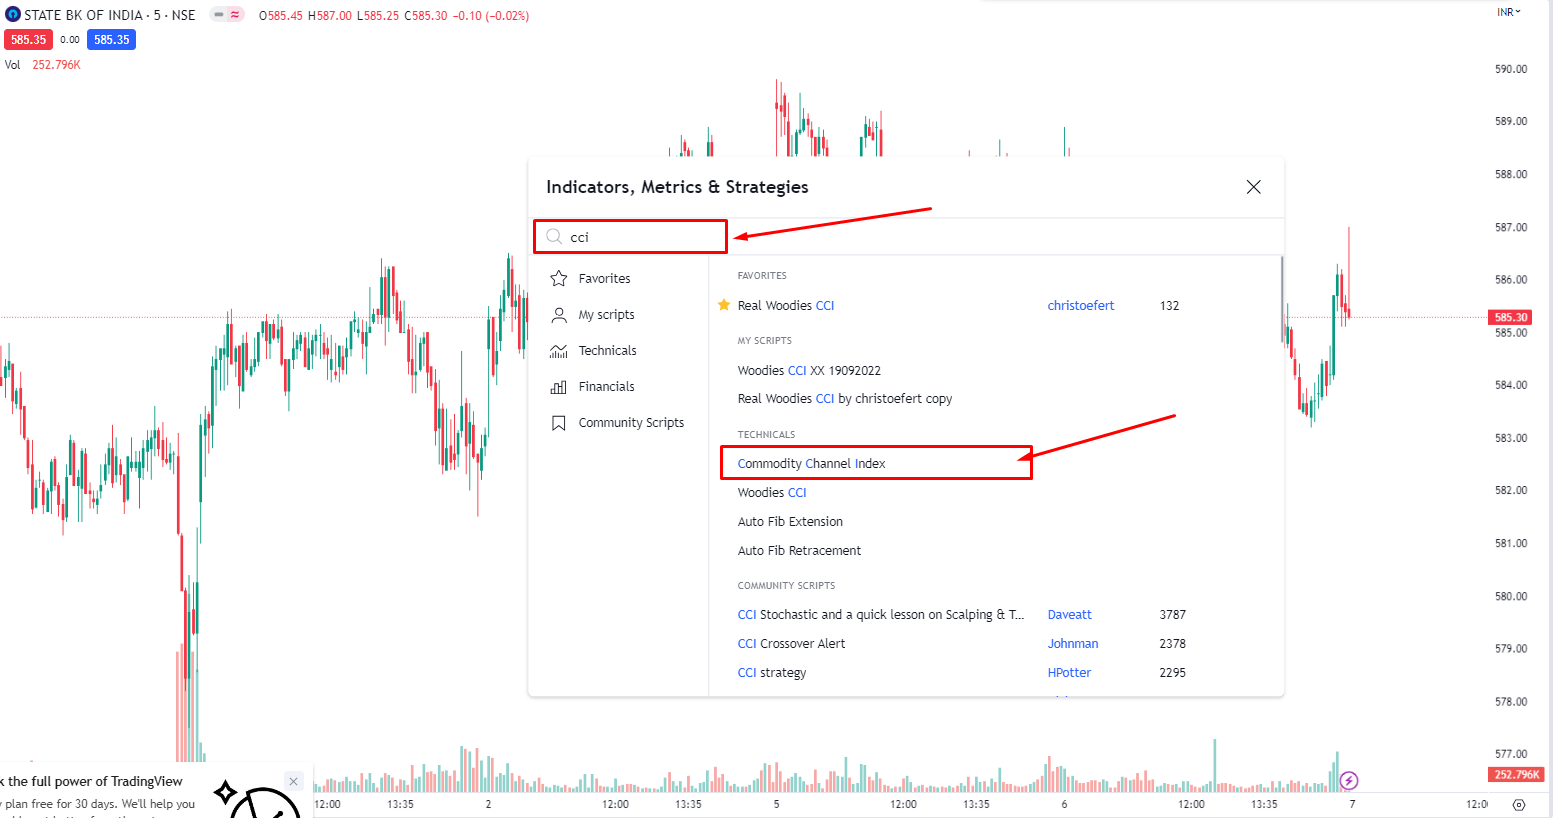
Search for CCI: In the search bar within the Indicators window, type “Commodity Channel Index” or simply “CCI.” As you type, a list of available indicators will appear.
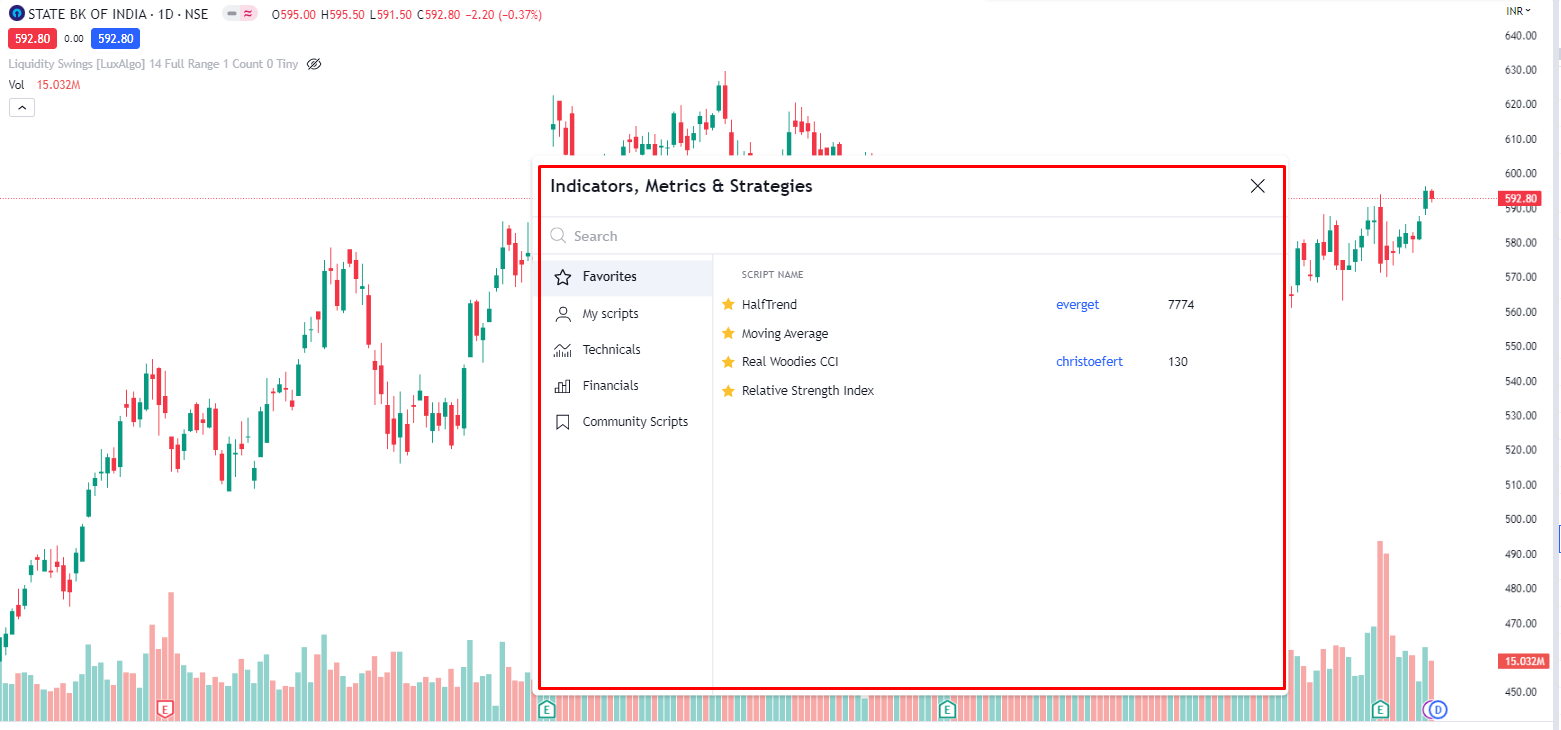
Click on CCI: From the list of indicators that appear, select “Commodity Channel Index (CCI)” by clicking on it. This will open the CCI configuration settings.
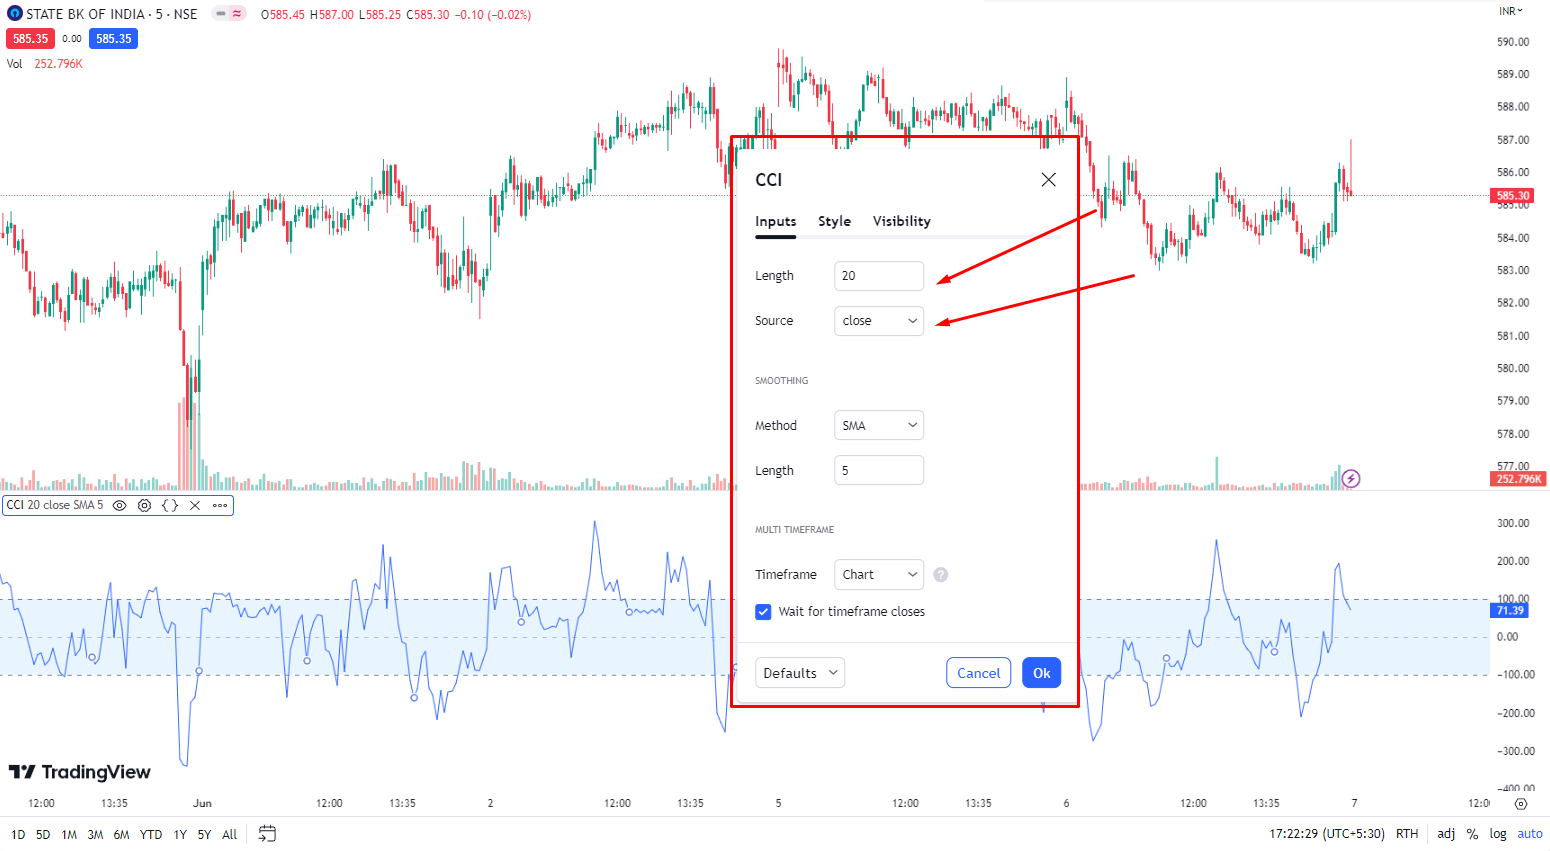
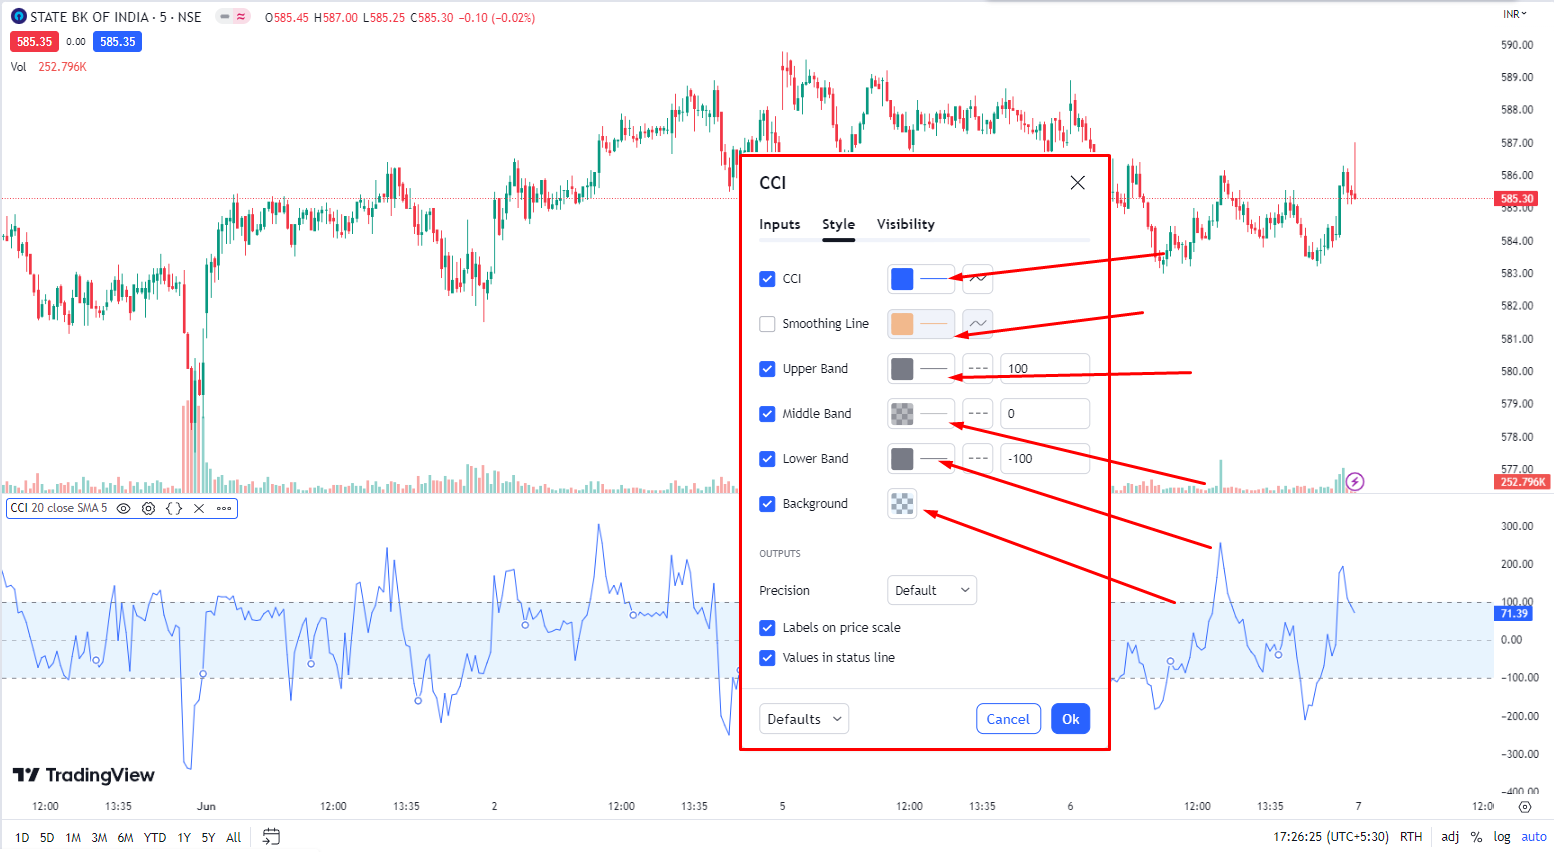
Customize CCI Settings: The CCI settings window allows you to adjust various parameters to suit your preferences. You can modify the period length, moving average type, and overbought/oversold levels. Take your time to experiment with different settings or use the default values.
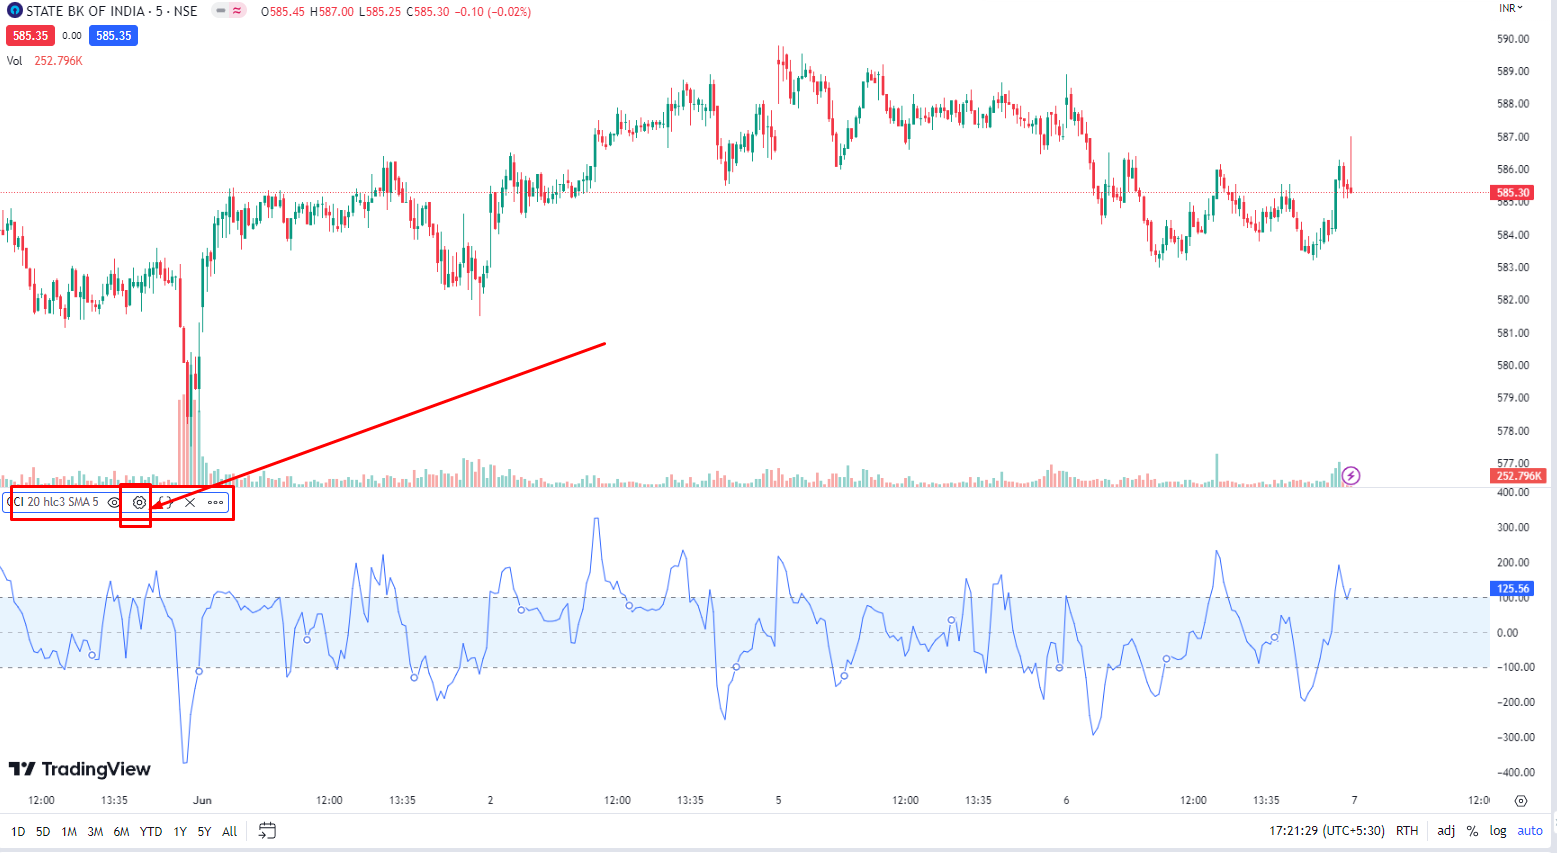
Apply CCI to the Chart: After configuring the CCI settings, click the “Apply” button at the bottom of the settings window. The CCI indicator will now be overlaid on the chart.
Analyze CCI Signals: As the CCI indicator is now visible on your chart, you can start interpreting its signals. Look for overbought and oversold levels, divergence patterns, and changes in trend strength. Remember to combine CCI analysis with other indicators and tools to gain a comprehensive view of the market.
Save and Customize: Once you have set up the CCI indicator on your chart, you can save it as a template for future use. Additionally, TradingView allows you to customize the appearance of the indicator, such as adjusting the color, line thickness, or style, to suit your visual preferences.
By following these steps, you can easily add the Commodity Channel Index (CCI) indicator to your TradingView platform and leverage its insights in your trading analysis. Remember to conduct thorough research and analysis, and consider using CCI in conjunction with other indicators and strategies to enhance your decision-making process.
Thank you for reading this article.