TradingView is a popular online platform that provides tools and resources for international traders and investors. One of the key features of TradingView is its extensive library collection of indicators.
TradingView Indicators are mathematical calculations based on historical price and volume data. These indicators help you to analyze market trends, identify potential entry and exit points, and make informed trading decisions. TradingView offers various indicators, including popular ones like moving averages, oscillators, trend lines, and more.
Traders can apply these indicators to their charts, which display the price movements of financial instruments such as stocks, cryptocurrencies, forex pairs, and commodities. Indicators can be customized with different parameters and settings to suit individual trading strategies and preferences.
TradingView also allows users to create and share their own custom indicators. This feature enables you to develop unique trading strategies and collaborate with others in the TradingView community.
Overall, TradingView indicators provide valuable insights and tools for technical analysis, helping traders better understand market dynamics and improve their trading decisions.
TradingView Indicator Collections
A wide range of Indicator collections are seen on the Tradingview platform. 1000+ inbuild indicators that can help you to choose your best one. On some other platforms like Amibroker, Metastock, you need to help some coding experts to implement an indicator. Here you can not download or find any source for these indicator collections.
In this TradingView indicator section, you can see more and more indicator collections which is the most powerful trading tool for any trader. For various types of analysts, you can go through some basic knowledge which is posted here.
How to add an Indicator on TradingView Chart
Firstly, go to the site Tradingview.
Go to the login in the Top right side corner. It’s free as of now.

After Sign In, you will see this type of page view.
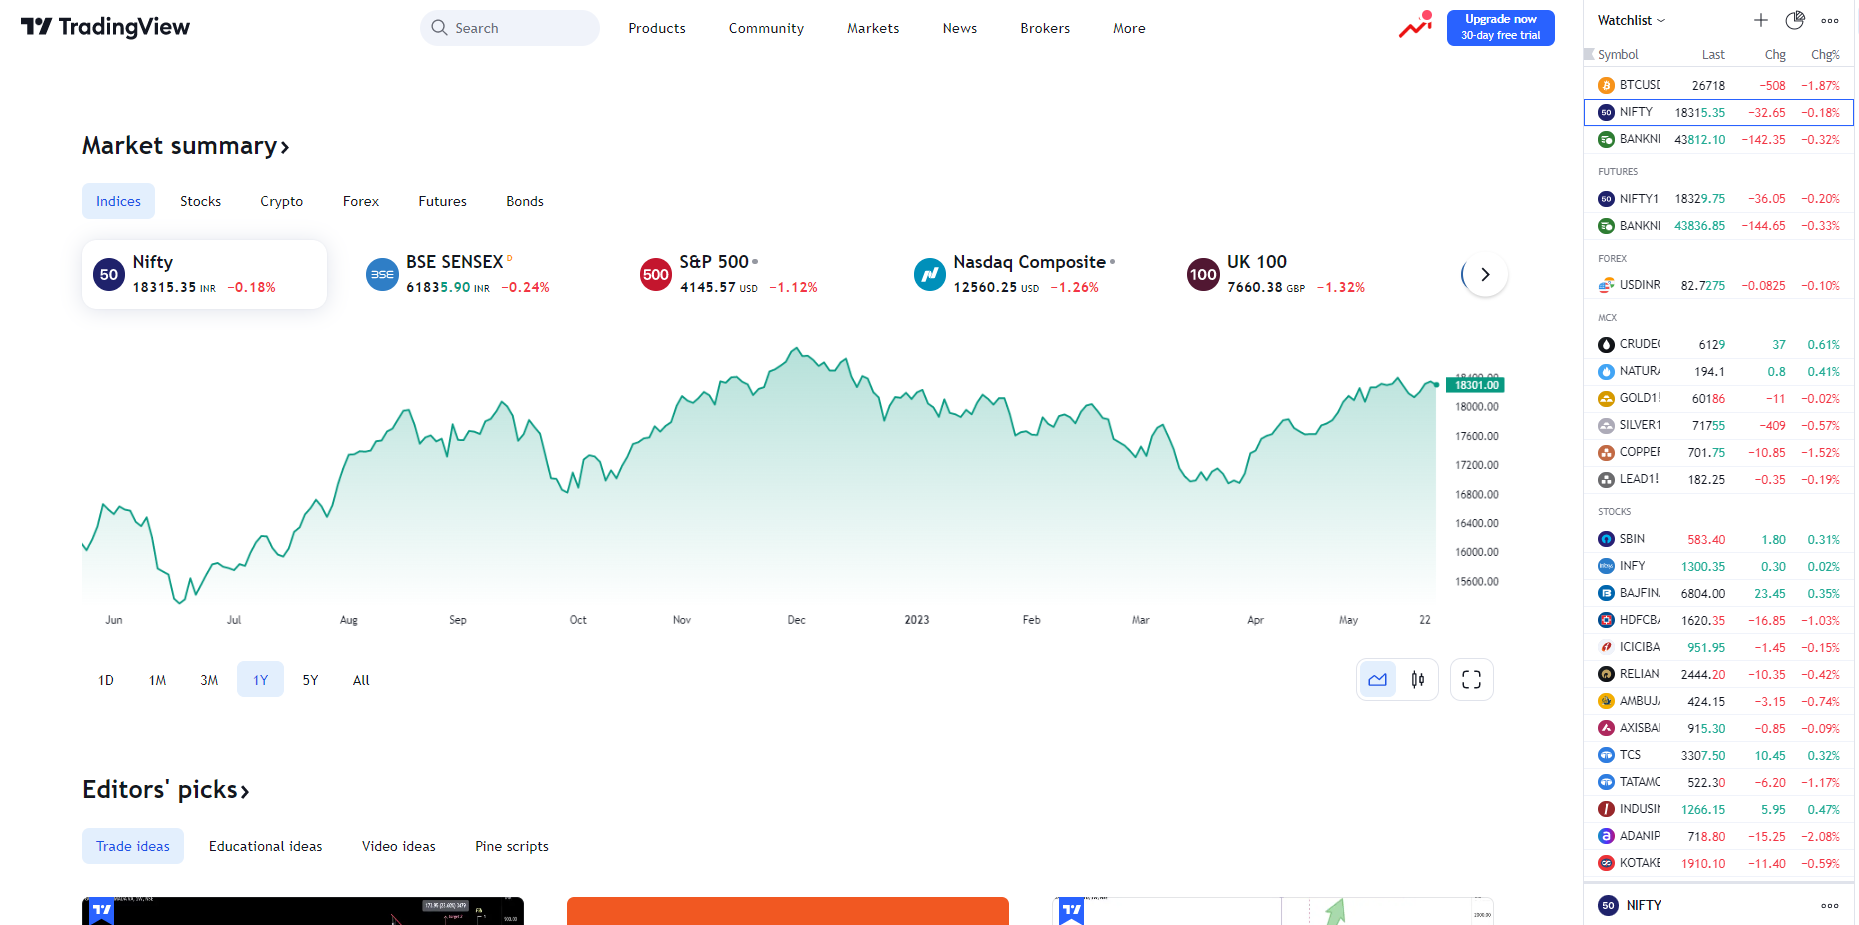
On the Product Tab, you will see a “Superchart” section. Just click on it and you can find the tradingview candlestick chart pattern view.

Here you will see some stock list right side of the chart and drawing & supporting tools on the left side of the chart. This is called a blank chart. Now you want to add some indicators to this chart. Let’s move on.
Go to the Indicator section on the top side of the chart. After clicking on it, you will see an indicator pop-up window on top.

Now you can write any type of indicator in the searching area. There are some common or basic tools that are used mostly like, RSI, CCI, MACD, and many more.

Now, for some trending indicators or some popular indicators like Supertrend, Woodies CCI, Elliot Wave pattern & etc.
Indicator Chart Example
Supertrend Indicator

Woodies CCI Indicator

Elliot Wave Indicator

HalfTrend Indicator

Guppy Multiple Moving Average Indicator

Conclusion
In conclusion, TradingView indicators play a crucial role in the trading community by providing traders with valuable insights and analysis tools. These indicators meet the needs of traders by offering a wide range of technical analysis methods, customization options, and real-time data visualization. Traders / you can identify market trends, make informed trading decisions, and create effective trading strategies. The user-friendly interface and collaborative community of TradingView further enhance its appeal.
However, you must remember that indicators should be used in conjunction with other analysis techniques and risk management strategies to maximize their effectiveness. Overall, TradingView indicators fulfill the needs of traders for comprehensive market analysis and informed decision-making.