If you are looking to trade a stock using the support and resistance levels, it is essential to first understand what these levels are and how they can be used in technical analysis.
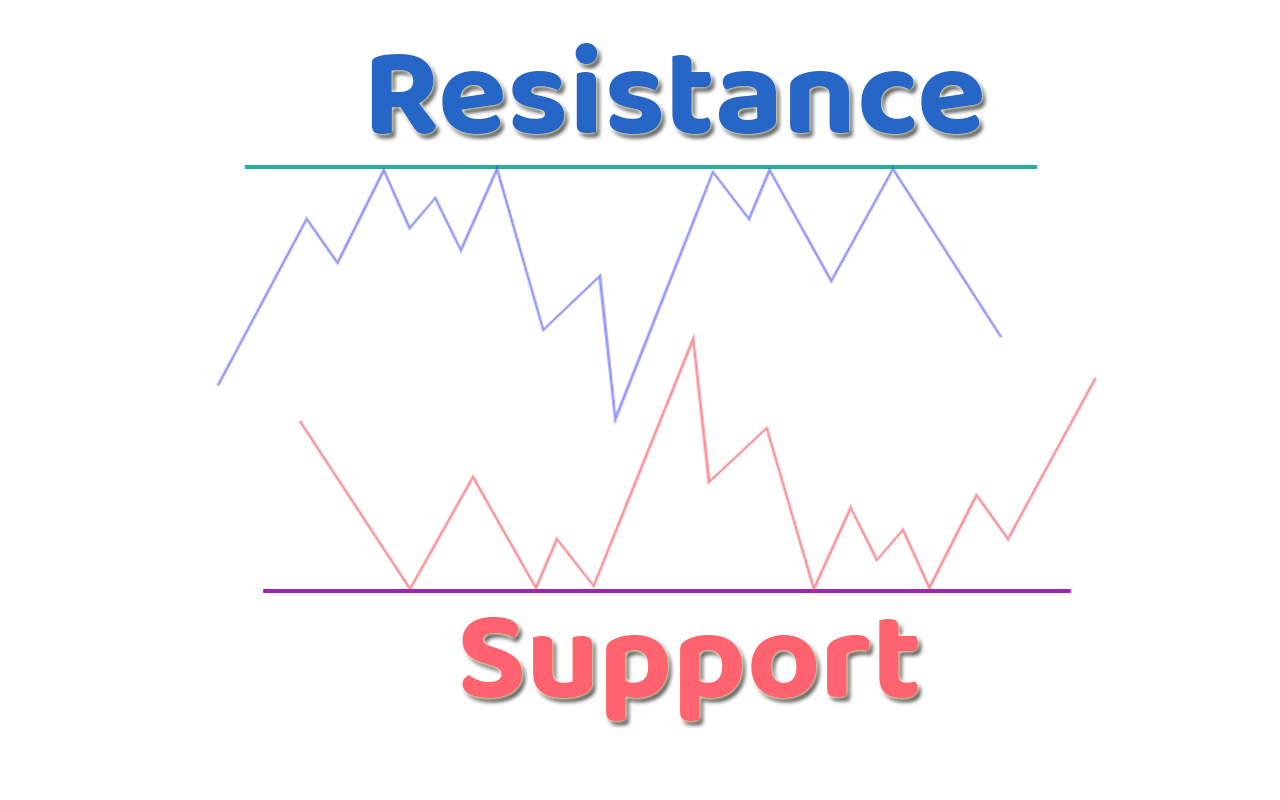
Support and resistance levels are price levels at which the market has historically encountered buying or selling pressure that has caused the price to pause or reverse. The support level is the price level at which the market has historically found buying pressure sufficient to prevent the price from declining further. The resistance level is the price level at which the market has historically encountered selling pressure sufficient to prevent the price from rising further.
To trade stock using support and resistance levels, you can use these levels to identify potential entry and exit points for your trades. For example, if the stock is approaching a support level, you may consider entering a long position, as you believe that the buying pressure at this level will likely cause the price to rise. Conversely, if the stock is approaching a resistance level, you may consider entering a short position, as you believe that the selling pressure at this level will likely cause the price to decline.
It is important to note that support and resistance are not exact price levels but zones. The market can fluctuate within a certain range before breaking out of the level, so it is essential to use additional technical indicators and analysis techniques to confirm the potential trade.
In summary, using support and resistance levels can be a useful tool when trading stock. By identifying potential entry and exit points based on historical buying and selling pressure, you can make more informed trading decisions.

What is Support & Resistance –
Full guidance is already published on my website. You can go through the chapter for detailed information.
How to trade using Support & Resistance –
Now that you understand what support and resistance are let’s look at how you can use them to trade stocks successfully. The first step is to identify the support and resistance levels of the stock you’re interested in. You can do this by analyzing the historical price movements of the stock. Once you’ve identified the support and resistance levels, you can use them to guide your trades.
If a stock is trading near its support level, it’s a good time to buy. This is because the support level is likely to prevent the stock from falling further, and buyers are likely to enter the market at this level. On the other hand, if a stock is trading near its resistance level, it’s a good time to sell. This is because the resistance level is likely to prevent the stock from rising further, and sellers are likely to enter the market at this level.
It’s important to note that support and resistance levels are not always exact. Prices can break through these levels, and when they do, it can indicate a trend reversal. For example, if a stock breaks through its resistance level, it could indicate that the stock is now in an uptrend, and it’s a good time to buy.
Three major points to trade using Support & Resistance –
Trading using support and resistance is a popular strategy among technical traders. By identifying key levels of support and resistance on a price chart, traders can gain insights into the market’s overall direction and potential turning points. Here are three major points to consider when trading using support and resistance.
- Understanding Support and Resistance Levels
Support and resistance levels are key levels on a price chart where buyers and sellers are likely to enter or exit the market. Support levels are areas where buying pressure has previously halted or reversed a downtrend, while resistance levels are areas where selling pressure has previously halted or reversed an uptrend.
To identify support and resistance levels, traders often look for areas on the chart where the price has bounced multiple times, creating a horizontal line. They can also look for areas where the price has broken through a previous level, indicating a potential change in the market’s direction.

- Using Support and Resistance Levels to Trade
Traders can use support and resistance levels to help identify potential entry and exit points for trades. For example, if the price of a stock is approaching a strong resistance level, traders may consider selling or taking profits on a long position. Alternatively, if the price is approaching a strong support level, traders may consider buying or entering a long position.
It’s important to note that support and resistance levels are not always precise, and the market can sometimes break through them. Therefore, traders should also use other indicators and analyses to confirm their trades.

- Additional Considerations When Trading with Support and Resistance
When trading with support and resistance, traders should also consider the overall trend of the market. If the market is trending higher, traders may want to focus on buying opportunities near support levels rather than selling opportunities near resistance levels.
Traders should also be aware of potential fakeouts, where the price temporarily breaks through a support or resistance level before quickly reversing. To avoid being caught in a fakeout, traders can wait for confirmation of a breakout or breakdown before entering a trade.
In summary, trading using support and resistance levels can provide valuable insights into the market’s overall direction and potential turning points. By understanding how to identify support and resistance levels, using them to trade, and considering additional factors, traders can improve their chances of success.
Now you can also check out the trading strategy with this article here.
The Importance of Stop-Loss Orders –
Stop-loss orders are essential when trading using support and resistance levels. A stop-loss order is an order to sell a stock if it reaches a certain price level. This can help limit your losses if the stock falls below its support level. If a stock falls below its support level, it could indicate that the stock is now in a downtrend, and it’s time to sell.

Here are some reasons why using stop-loss orders is important when trading with support and resistance levels.
- Protecting Against Large Losses
One of the main benefits of using a stop-loss order is that it helps traders limit their potential losses. When trading with support and resistance levels, traders are often looking for key areas where the price may reverse. However, these levels are not always precise, and the market can sometimes continue to move against the trader. A stop-loss order can help limit losses if the market moves in an unexpected direction.
- Preserving Trading Capital
Another benefit of using stop-loss orders is that they can help traders preserve their trading capital. If a trader doesn’t use a stop-loss order and the market moves against them, they may end up losing a significant portion of their trading capital. By using a stop-loss order, traders can limit their potential losses and preserve their capital for future trades.
- Removing Emotional Bias
Using a stop-loss order can also help traders remove emotional bias from their trading decisions. Without a stop-loss order, traders may be tempted to hold onto a losing position in the hopes that the market will eventually turn in their favor. This can lead to irrational decision-making and potentially larger losses. By using a stop-loss order, traders can make rational decisions based on predetermined criteria rather than emotions.

- Aligning with Support and Resistance Levels
Finally, using a stop-loss order can help traders align their trades with support and resistance levels. If a trader has identified a key support or resistance level, they can place a stop-loss order just below or above that level, respectively. This can help them limit their losses if the market breaks through the support or resistance level.
In summary, using stop-loss orders is an important part of trading with support and resistance levels. Stop-loss orders can help traders limit their potential losses, preserve their trading capital, remove emotional bias, and align their trades with support and resistance levels. Traders should always use stop-loss orders to help manage their risk and protect their trading capital.
How are support and resistance levels determined –
Support and resistance levels are important concepts in technical analysis that traders use to identify potential areas of buying or selling activity in the market. These levels are determined using various methods, including:
- Price Action Analysis
Price action analysis involves studying historical price movements to identify key levels of support and resistance. Traders will look for areas where the price has previously bounced off a certain level, indicating that this level is significant in the market. They may also look for areas where the price has previously broken through a certain level, indicating a potential change in market direction.

- Trendlines
Trendlines are another method used to identify support and resistance levels. Traders will draw a line connecting two or more price points in a trend, either on an uptrend or a downtrend. This line can then be used as a support or resistance level depending on the direction of the trend.

- Moving Averages
Moving averages are commonly used by traders to identify support and resistance levels. Traders will look for areas where the price has previously bounced off a moving average, indicating that this level is significant in the market.

- Fibonacci Retracement Levels
Fibonacci retracement levels are used by traders to identify potential areas of support and resistance based on the Fibonacci sequence. Traders will draw lines connecting the high and low points of a trend and then use the Fibonacci retracement levels (23.6%, 38.2%, 50%, 61.8%, and 100%) to identify potential areas of support and resistance.

- Pivot Points
Pivot points are calculated using the previous day’s high, low, and closing prices to determine potential areas of support and resistance for the current trading day. Traders will use these levels to identify potential areas of buying or selling activity in the market.
Trade a stock using the Support and Resistance – Conclusion
In conclusion, support and resistance levels can be determined using various methods such as price action analysis, trendlines, moving averages, Fibonacci retracement levels, and pivot points. Traders can use these levels to make informed trading decisions and identify potential areas of buying or selling activity in the market.
For any type of real-time chart and virtual cash trading, you can use the website.


