Introduction to the RSI Indicator
Have you ever wondered if there’s a single tool that could transform your trading game completely? Well, let me introduce you to one of the most powerful indicators in technical analysis: the Relative Strength Index, commonly known as RSI. This isn’t just another fancy line on your chart—it’s a game-changing tool that has helped countless traders identify profitable opportunities across different markets and time frames.
The RSI indicator has earned its reputation as a powerhouse in the trading world for good reason. Whether you’re trading stocks, forex, cryptocurrencies, or commodities, RSI provides valuable insights into market momentum and potential reversal points. What makes it truly special is its versatility and reliability when used correctly. Imagine having a compass that guides you through the often confusing landscape of price movements—that’s essentially what RSI does for traders.
Understanding the Basics of RSI
What Does RSI Measure?
At its core, the RSI measures the speed and magnitude of price movements. Think of it as a speedometer for your favourite stock or currency pair. Developed by J. Welles Wilder Jr. in 1978, this momentum oscillator compares the magnitude of recent gains to recent losses, helping traders determine whether an asset is potentially overbought or oversold.
The beauty of RSI lies in its simplicity. It takes complex price action and condenses it into a single number that oscillates between 0 and 100. This makes it incredibly easy to read and interpret, even for beginners who are just starting their trading journey.
The Scale and Interpretation
RSI operates on a scale from 0 to 100, with specific zones that signal different market conditions. The midpoint at 50 often acts as a baseline, separating bullish territory (above 50) from bearish territory (below 50). But the real magic happens at the extremes.
When RSI climbs above 70, it suggests that the asset might be overbought—meaning buyers have been so enthusiastic that a pullback could be on the horizon. Conversely, when RSI drops below 30, it indicates oversold conditions, suggesting that sellers may have pushed prices too low and a bounce might be coming. These aren’t rigid rules, though. Markets can remain overbought or oversold for extended periods during strong trends.
Overbought and Oversold Conditions
Understanding overbought and oversold conditions is like learning to read the market’s emotions. When everyone is buying frantically, and RSI shoots above 70, it’s like a party that’s getting too crowded—eventually, people start leaving. Similarly, when panic selling drives RSI below 30, it’s like a fire sale where everything seems too cheap to ignore.
However, here’s where experience comes into play: overbought doesn’t automatically mean “sell,” and oversold doesn’t always mean “buy.” In strong uptrends, RSI can remain above 70 for extended periods, and in downtrends, it can stay below 30. This is why context matters, and why successful traders look for additional confirmation signals.
Why RSI Works Across All Markets and Time Frames
Universal Application
One of the most remarkable aspects of RSI is its universal applicability. Whether you’re day trading cryptocurrency on a 5-minute chart or swing trading stocks on a daily chart, RSI provides consistent and reliable signals. This universality stems from the fact that RSI measures fundamental market dynamics—the relationship between buyers and sellers—which remains constant across different assets and time frames.
I’ve seen traders successfully apply RSI to everything from penny stocks to blue-chip companies, from major currency pairs to exotic cryptocurrencies. The principles remain the same, making it an invaluable tool in any trader’s arsenal.
Flexibility in Trading Strategies
RSI isn’t a one-trick pony. It can be adapted to virtually any trading style. Scalpers use it on 1-minute charts to catch quick momentum shifts. Day traders rely on it for intraday reversal signals. Swing traders use it to identify multi-day trend changes. Even long-term investors can use weekly or monthly RSI readings to time their entries and exits better.
This flexibility means you can grow with the indicator. As you develop as a trader and refine your strategy, RSI continues to provide value, adapting to your evolving needs and trading style.
Key RSI Trading Techniques
Traditional RSI Signals
The most straightforward way to use RSI is through traditional overbought and oversold signals. When RSI crosses above 70, it warns of potential exhaustion in the upward move. When it crosses below 30, it suggests the downward momentum might be overdone. Many traders wait for RSI to move back below 70 or above 30 as confirmation before taking action.
Another classic signal occurs when RSI crosses the 50 level. A move above 50 can signal strengthening momentum in an uptrend, while a drop below 50 might indicate building bearish pressure. These midpoint crosses are particularly useful in trending markets where you want to stay on the right side of momentum.
Divergence Trading
Divergence is where RSI truly shows its power as a leading indicator. Bullish divergence occurs when the price makes a lower low, but the RSI makes a higher low. This suggests that although price is falling, the selling momentum is weakening—a potential reversal signal. Bearish divergence is the opposite: price makes a higher high while RSI makes a lower high, indicating weakening buying pressure despite higher prices.
Trading divergences requires patience and practice, but the rewards can be substantial. These setups often precede significant trend reversals, allowing you to enter trades before the broader market catches on.
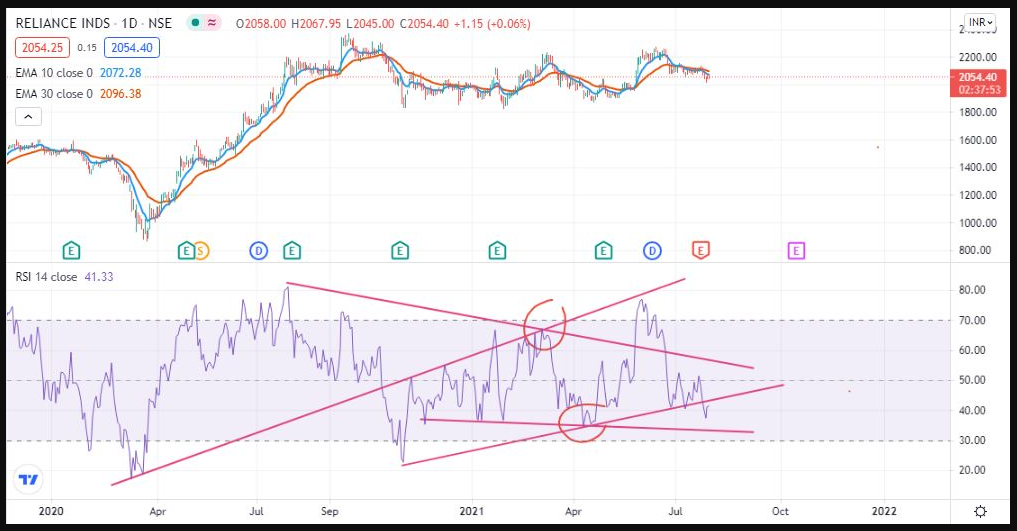
RSI Trendline Breaks
Here’s a technique many traders overlook: drawing trendlines directly on the RSI indicator itself. Just as you would draw trendlines on a price chart, you can connect the highs and lows on your RSI. When RSI breaks these trendlines, it often precedes a break in the price trendline, giving you an early warning signal.
This technique combines the power of trendline analysis with momentum confirmation, creating a robust signal that can significantly improve your trading timing.
The Double Crossing Technique: A Game-Changer
What is Double Crossing?
Now, let’s talk about one of the most powerful RSI techniques: the double crossing pattern. This is where things get really interesting. A double crossing occurs when RSI crosses a key level (like 50, 70, or 30) twice in quick succession, confirming a strong momentum shift in the market.
Think of it as the market testing a level, pulling back briefly, and then pushing through with conviction. This two-step confirmation reduces false signals and increases the probability of a successful trade. It’s like watching someone try to open a door twice—the second attempt shows they’re serious about getting through.
How to Identify Double Crossing Patterns
Identifying double crossings requires attentive chart watching, but once you know what to look for, they become easier to spot. First, watch for RSI to cross a significant level—let’s say it crosses above 50. Then, look for a brief pullback where RSI dips back below 50 momentarily before crossing back above it.
This double-cross action confirms that buyers (in this case) are in control and willing to defend the momentum. The brief pullback that occurs between the two crosses often provides an excellent entry point, as it shakes out weak hands before the move continues.
Real-World Examples of Double Crossing
Let me paint you a picture of how powerful this can be. Imagine watching a stock that’s been in a downtrend. RSI crosses above 30, signalling potential oversold conditions. But instead of rallying immediately, the stock dips again, and RSI briefly touches 30 again before bouncing back above it. This double crossing at the oversold level is a strong signal that sellers are exhausted and buyers are stepping in.
The beauty of this pattern is that it provides both an entry signal and a clear invalidation point. If RSI fails to hold above the key level after the second cross, you know the pattern has failed and can exit quickly with minimal loss. When the pattern succeeds, however, the profits can be substantial as the new trend unfolds.
Step-by-Step Guide to Trading with RSI
Setting Up RSI on Your Chart
Getting started with RSI is straightforward. Most trading platforms include RSI as a standard indicator. The default setting is typically 14 periods, which works well for most situations. To add it to your chart, simply navigate to your platform’s indicator menu and select RSI.
Once applied, you’ll see the RSI plotted in a separate window below your price chart, oscillating between 0 and 100. Many traders also add horizontal lines at 30 and 70 to mark the traditional overbought and oversold zones. Some prefer to add an additional line at 50 to highlight the momentum midpoint.
Identifying Entry Points
Entry points using RSI come from several setups. The most common is waiting for RSI to move into oversold territory (below 30) and then crossing back above 30 as your buy signal. For short positions, you’d wait for RSI to enter overbought territory (above 70) and then cross back below 70.
However, the double-crossing technique offers superior entries. When you spot RSI crossing a key level, then pulling back, then crossing again, that second cross provides your entry trigger. This confirmation reduces false signals and increases your win rate.
For divergence trades, your entry comes when price confirms the RSI signal—for instance, when price breaks above a recent high after bullish divergence appears on RSI.
Setting Stop-Loss and Take-Profit Levels
Risk management is crucial for long-term trading success. When entering based on RSI signals, your stop-loss should be placed beyond the recent swing point that formed your setup. For example, if you’re buying on an oversold bounce, place your stop below the low that created the oversold reading.
Take-profit levels can be set using several methods. Conservative traders might target the opposite RSI extreme—if you bought on an oversold signal, exit when RSI reaches overbought. More aggressive traders hold positions while RSI remains in favourable territory, only exiting when momentum clearly reverses.
Risk Management with RSI
Never risk more than you can afford to lose on any single trade. A good rule of thumb is risking no more than one to two per cent of your trading capital per trade. RSI helps you manage risk by providing clear entry and exit signals, but ultimately, position sizing and stop-loss placement determine your risk exposure.
Additionally, be wary of taking every RSI signal. Filter signals based on broader market context, trend direction, and other confirming indicators. Quality over quantity should be your mantra.
Advanced RSI Strategies for Expert Traders
Combining RSI with Other Indicators
While RSI is powerful on its own, combining it with other indicators creates even more robust trading strategies. Pairing RSI with moving averages helps you stay on the right side of the trend while using RSI for timing. When the price is above the 200-day moving average, and RSI becomes oversold, you have both trend and momentum on your side.
Another powerful combination is RSI with volume analysis. When RSI shows oversold conditions and volume spikes as price bounces, it confirms that buyers are stepping in with conviction. This multi-indicator approach reduces false signals and increases confidence in your trades.
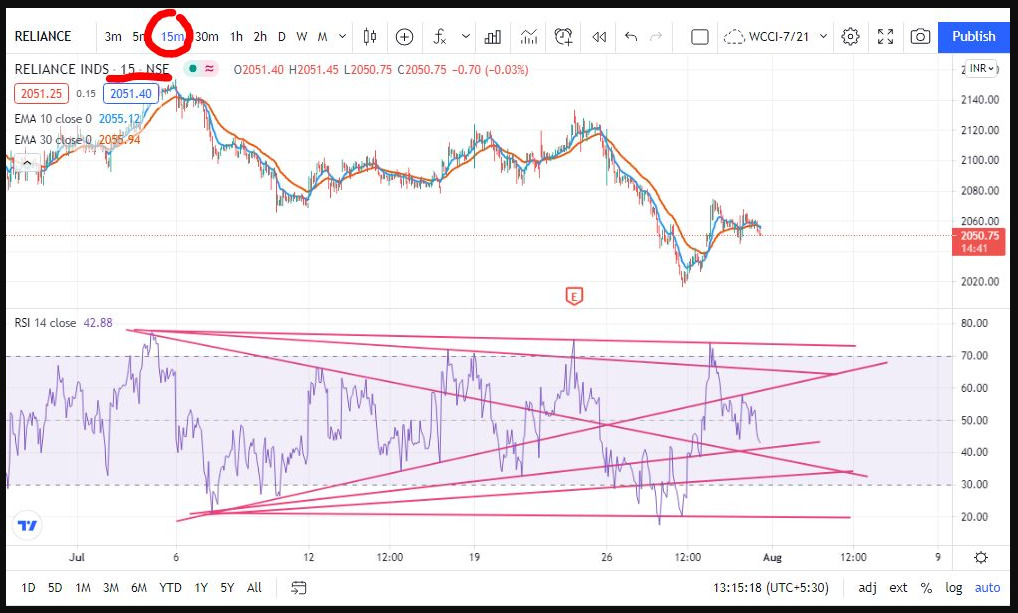
Multi-Time Frame Analysis
Professional traders don’t just look at RSI on one time frame—they analyse it across multiple time frames to get a complete picture. This technique involves checking RSI on a higher time frame to identify the broader trend, then dropping down to a lower time frame to time your entry.
For example, if daily RSI shows oversold conditions and is turning higher, you might switch to the 4-hour chart to find the precise entry point as RSI crosses above 30 on that shorter time frame. This alignment of signals across time frames dramatically improves your trading results.
RSI in Different Market Conditions
Markets aren’t always trending—sometimes they’re choppy and range-bound. RSI behaves differently in these varying conditions. In strong trends, traditional overbought and oversold levels (70 and 30) work less effectively because momentum can stay extreme for extended periods. Instead, you might use 80 and 20 as your extremes, or focus on the 50-level crosses for trend continuation signals.
In ranging markets, the traditional 70 and 30 levels work beautifully. RSI bouncing between these extremes provides excellent signals to buy oversold dips and sell overbought rallies within the range.
Common Mistakes to Avoid When Using RSI
Relying Solely on RSI
One of the biggest mistakes traders make is treating RSI as a magic bullet. No single indicator, no matter how powerful, should be used in isolation. RSI provides valuable information about momentum, but it doesn’t tell you everything about market structure, volume, or fundamental factors that might be driving price action.
Think of RSI as one tool in your toolbox. A carpenter wouldn’t try to build a house with just a hammer, and you shouldn’t try to trade with just RSI. Use it with price action analysis, support and resistance levels, trend identification, and other technical tools.
Ignoring Market Context
RSI signals must be interpreted within the broader market context. An oversold reading during a strong downtrend is very different from an oversold reading after a healthy correction in an uptrend. The former might just be a brief pause before more selling, while the latter could be an excellent buying opportunity.
Always ask yourself: What’s the bigger picture? Is this asset in an uptrend, a downtrend, or a range? What’s happening in related markets? Are there upcoming events that might impact the price? Context transforms RSI from a simple indicator into a powerful decision-making tool.
Overtrading Based on False Signals
Not every RSI signal deserves action. The temptation to trade every overbought or oversold reading can lead to overtrading, which racks up commissions and taxes while exposing you to unnecessary risk. Be selective. Wait for high-probability setups that align with your trading plan and risk management rules.
Remember, sometimes the best trade is no trade at all. Patience and discipline separate successful traders from those who struggle.
Building Your RSI Watchlist
Selecting the Right Stocks or Assets
Not all stocks and assets are created equal when it comes to RSI trading. Look for assets with sufficient liquidity and volatility. Too little liquidity means wide spreads and slippage. Too little volatility means RSI might not reach extreme levels often enough to provide trading opportunities.
Start by scanning for stocks or assets where RSI has recently reached extreme levels or is showing interesting patterns like divergence or double crossings. Build a focused watchlist of 10 to 20 assets that you monitor regularly, rather than trying to track hundreds.
Monitoring Multiple Time Frames
Your watchlist should include notes about what’s happening on different time frames. An asset might be oversold on the daily chart but still showing bearish momentum on the weekly chart. These multi-time frame perspectives help you prioritise opportunities and avoid conflicting signals.
Set up alerts for when RSI crosses key levels on your watchlist assets. Most trading platforms allow custom alerts that will notify you when RSI moves above or below specific thresholds, saving you from having to constantly watch charts.
Keeping Track of Key Levels
For each asset on your watchlist, note the key support and resistance levels alongside your RSI analysis. When RSI signals align with important price levels, the probability of success increases significantly. For instance, an oversold RSI reading at a major support level creates a high-probability long setup.
Maintain a trading journal where you track your RSI-based trades, noting what worked and what didn’t. This record becomes invaluable for refining your approach over time.
RSI and Technical Analysis Mastery
Becoming an Expert Trader
Mastery of RSI doesn’t happen overnight. It requires dedication, practice, and a willingness to learn from both successes and failures. Start by paper trading your RSI strategies before risking real capital. This allows you to develop confidence in identifying and executing setups without financial pressure.
Study historical charts to see how RSI behaved at significant turning points. Look for patterns that repeat. The more charts you analyse, the more intuitive RSI interpretation becomes. Over time, you’ll develop a feel for when RSI signals are likely to play out and when they might fail.
Continuous Learning and Practice
The markets are constantly evolving, and so should your trading skills. Join trading communities where you can discuss RSI strategies with other traders. Watch educational videos and read books about technical analysis. The more perspectives you’re exposed to, the more nuanced your understanding becomes.
Practice doesn’t mean randomly taking trades. It means deliberately working on specific aspects of your RSI trading—perhaps focusing one month on divergence patterns, the next on double crossings, and so on. This focused practice accelerates your learning curve.
Conclusion
The RSI indicator truly deserves its reputation as one of the most powerful tools in technical analysis. From its simple interpretation of overbought and oversold conditions to advanced techniques like double crossing and divergence trading, RSI provides traders with a comprehensive framework for understanding market momentum and timing entries and exits.
What makes RSI particularly valuable is its universal applicability across all markets and time frames, combined with its flexibility to adapt to different trading styles and strategies. Whether you’re a beginner just starting your trading journey or an experienced trader looking to refine your edge, mastering RSI can significantly improve your results.
Remember, success with RSI comes from understanding its principles deeply, practising consistently, applying it within a proper context, and always managing your risk effectively. The double-crossing technique, in particular, offers a powerful way to filter signals and increase your probability of success. By incorporating RSI into a well-rounded trading approach that includes price action analysis, risk management, and continuous learning, you’re setting yourself up for long-term trading success.
The journey to becoming an expert trader is ongoing, but with RSI in your toolkit and a commitment to mastering it, you’re well-equipped to navigate the markets with confidence and skill.
FAQs
1. What is the best time frame to use RSI for trading?
There’s no single “best” time frame for RSI—it depends on your trading style. Day traders typically use 5-minute to 1-hour charts, swing traders prefer daily charts, and position traders look at weekly or monthly time frames. For best results, analyse RSI across multiple time frames to get both the big picture trend and precise entry timing. The 14-period default setting works well across all time frames, though some traders adjust this based on their specific needs.
2. How reliable is the RSI double crossing technique?
The double crossing technique is more reliable than single RSI crosses because it requires confirmation of momentum. While no indicator is 100% accurate, double crossings filter out many false signals by requiring the market to test and confirm a level twice. When combined with proper context analysis and other technical factors like support and resistance, double crossings can achieve win rates significantly higher than chance. However, always use proper risk management regardless of how confident you are in any signal.
3. Can RSI be used effectively in both trending and ranging markets?
Yes, but the approach differs. In trending markets, focus on RSI pullbacks to the 50 level or use adjusted extreme levels (like 80/20 instead of 70/30) since momentum can stay extreme longer in strong trends. In ranging markets, traditional overbought and oversold levels (70/30) work excellently for buying dips and selling rallies within the range. The key is correctly identifying the market environment first, then adapting your RSI strategy accordingly.
4. Should I always buy when RSI is oversold and sell when it’s overbought?
No, this is a common mistake. Oversold doesn’t automatically mean “buy,” and overbought doesn’t automatically mean “sell.” In strong downtrends, RSI can remain oversold for extended periods while the price continues falling. In strong uptrends, RSI can stay overbought while the price keeps rising. Always consider the broader trend context and look for additional confirmation signals before acting on extreme RSI readings. The best approach is waiting for RSI to turn back from extreme levels, showing that momentum is actually shifting.
5. What other indicators work best when combined with RSI?
RSI pairs exceptionally well with moving averages to identify trend direction while using RSI for timing. Volume indicators add confirmation when RSI signals align with unusual volume activity. MACD complements RSI by providing trend and momentum information from a different mathematical perspective. Support and resistance levels are a crucial context for RSI signals—when RSI extremes coincide with key price levels, the signal strength increases. Many successful traders also combine RSI with Bollinger Bands to identify when price and momentum are both at extremes.detail on RSI is coming soon, and you can find out the easiest way to trade on a live market.
For more content, you can check here.
You can follow my social platforms here.
700+ YouTube content. You can subscribe to more live content here.
2200+ Twitter postings on live proof here.
Follow the Facebook page for updates.