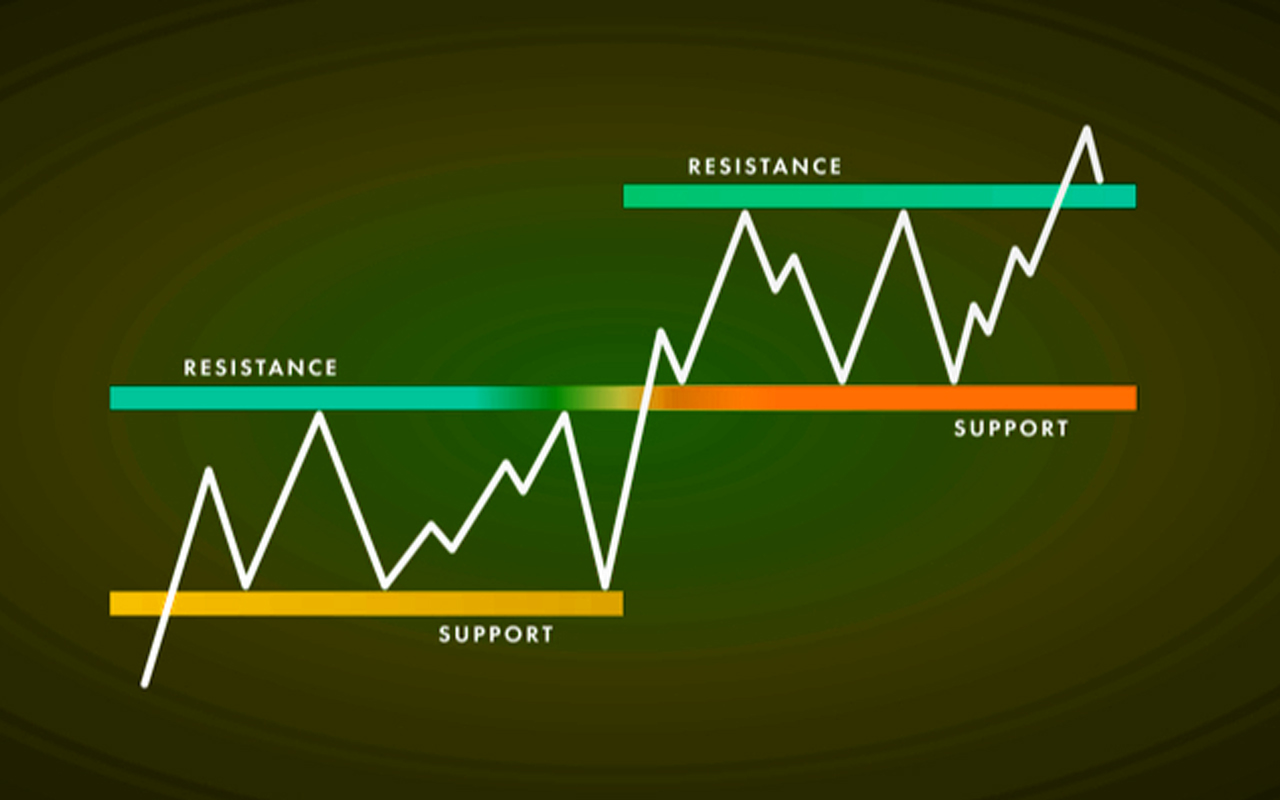
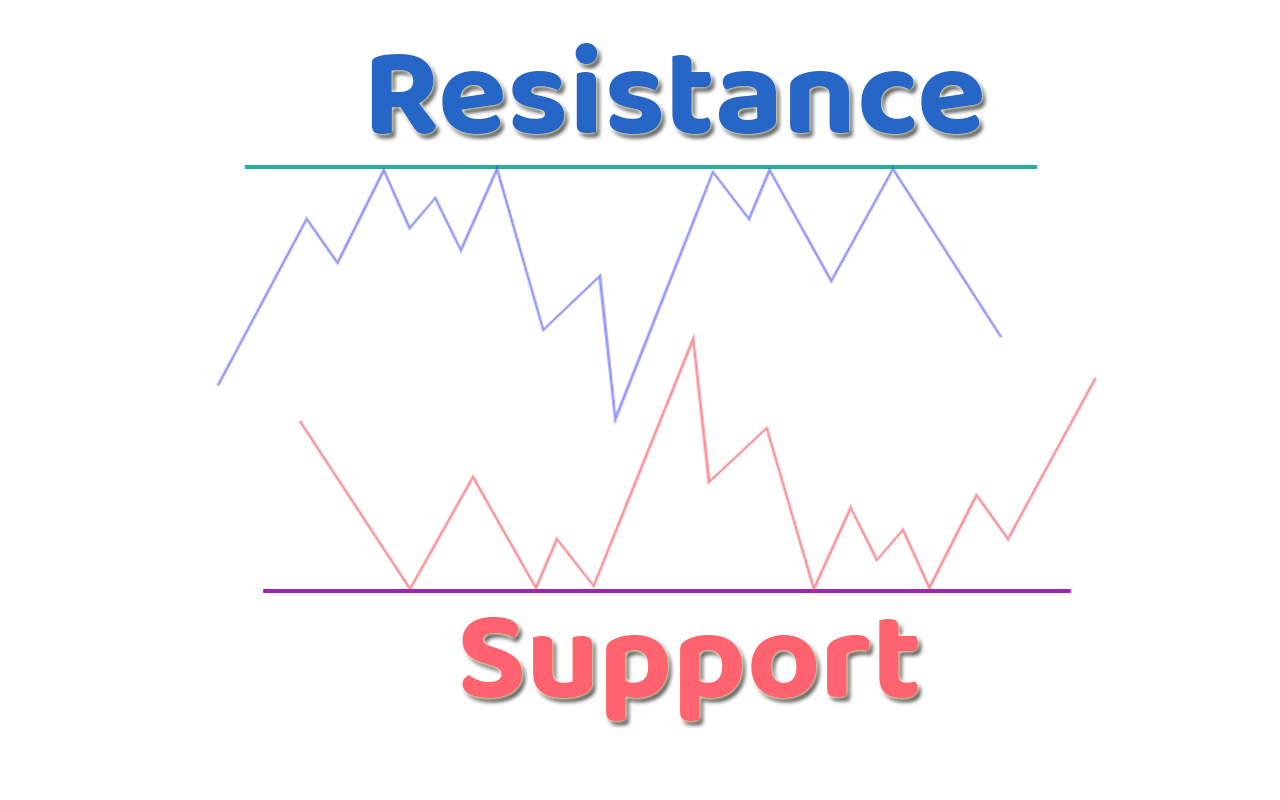
Support and resistance are two essential concepts in technical analysis, used by traders to determine potential price levels in the stock market. Support represents a price level where demand for a stock is strong enough to prevent it from falling further, while resistance represents a price level where selling pressure is high enough to prevent a stock from rising further. Understanding support and resistance levels can provide valuable insights into market trends and can be used to make informed trading decisions.
As an investor, understanding the concepts of support and resistance is crucial for successful trading in the stock market. In this article, we will explain what support and resistance are, and their importance, and provide examples to help you grasp their significance.
Support Means –
Support is a price level where buying interest is sufficient to overcome selling pressure, causing the stock’s price to reverse its downward trend. In other words, support is a level where there is demand for a stock, and investors are willing to buy the stock at that price. A support level is a price point at which a security, such as a stock, typically finds support and experiences buying pressure that prevents the price from falling further. In technical analysis, traders and investors use support levels to identify potential buying opportunities or to set stop-loss orders to limit their losses.
Support levels can be identified by looking at historical price data and chart patterns, such as trend lines or moving averages. They are considered significant because they represent areas where buyers have previously entered the market and are likely to do so again. If the price of a security falls below a support level, it is often seen as a bearish signal and may indicate that the price could continue to decline.
For example, let’s say that a stock has a support level of 100. If the stock price drops to 100, it is likely to find support from buyers who see it as a good opportunity to enter the market. However, if the price falls below 100, it could trigger a sell-off and the price may continue to decline.
In summary, support levels are important technical indicators used in the stock market to identify potential buying opportunities and limit potential losses. By identifying support levels, traders and investors can make informed decisions about when to buy or sell securities.
Resistance Means –
Resistance, on the other hand, is the opposite of support. Resistance is a price level where selling pressure is sufficient to overcome buying interest, causing the stock’s price to reverse its upward trend. In other words, resistance is a level where there is an excess supply of a stock, and investors are willing to sell the stock at that price.
A resistance level is a price point at which a security, such as a stock, typically experiences selling pressure and struggles to move higher. In technical analysis, traders and investors use resistance levels to identify potential selling opportunities or to set profit targets for their trades.
Resistance levels can be identified by looking at historical price data and chart patterns, such as trend lines or moving averages. They are considered significant because they represent areas where sellers have previously entered the market and are likely to do so again. If the price of a security rises above a resistance level, it is often seen as a bullish signal and may indicate that the price could continue to rise.
For example, let’s say that a stock has a resistance level of 100. If the stock price rises to 100, it is likely to encounter selling pressure from investors who see it as a good opportunity to take profits. However, if the price rises above 100, it could trigger a buying frenzy and the price may continue to rise.
In summary, resistance levels are important technical indicators used in the stock market to identify potential selling opportunities and set profit targets. By identifying resistance levels, traders and investors can make informed decisions about when to sell or hold their securities.
Importance of Support and Resistance on Stock Market –
Support and resistance levels are essential tools for investors because they help determine when to buy or sell a stock. When a stock’s price reaches a support level, it may be a good time to buy, as the price is expected to rebound. Similarly, when a stock’s price reaches a resistance level, it may be a good time to sell, as the price is expected to decline.
In addition, support and resistance levels can help investors determine the risk associated with a particular trade. For example, if a stock is trading close to its support level, the risk associated with buying the stock is relatively low, as there is a good chance that the stock’s price will rebound. Conversely, if a stock is trading close to its resistance level, the risk associated with buying the stock is relatively high, as there is a good chance that the stock’s price will decline.
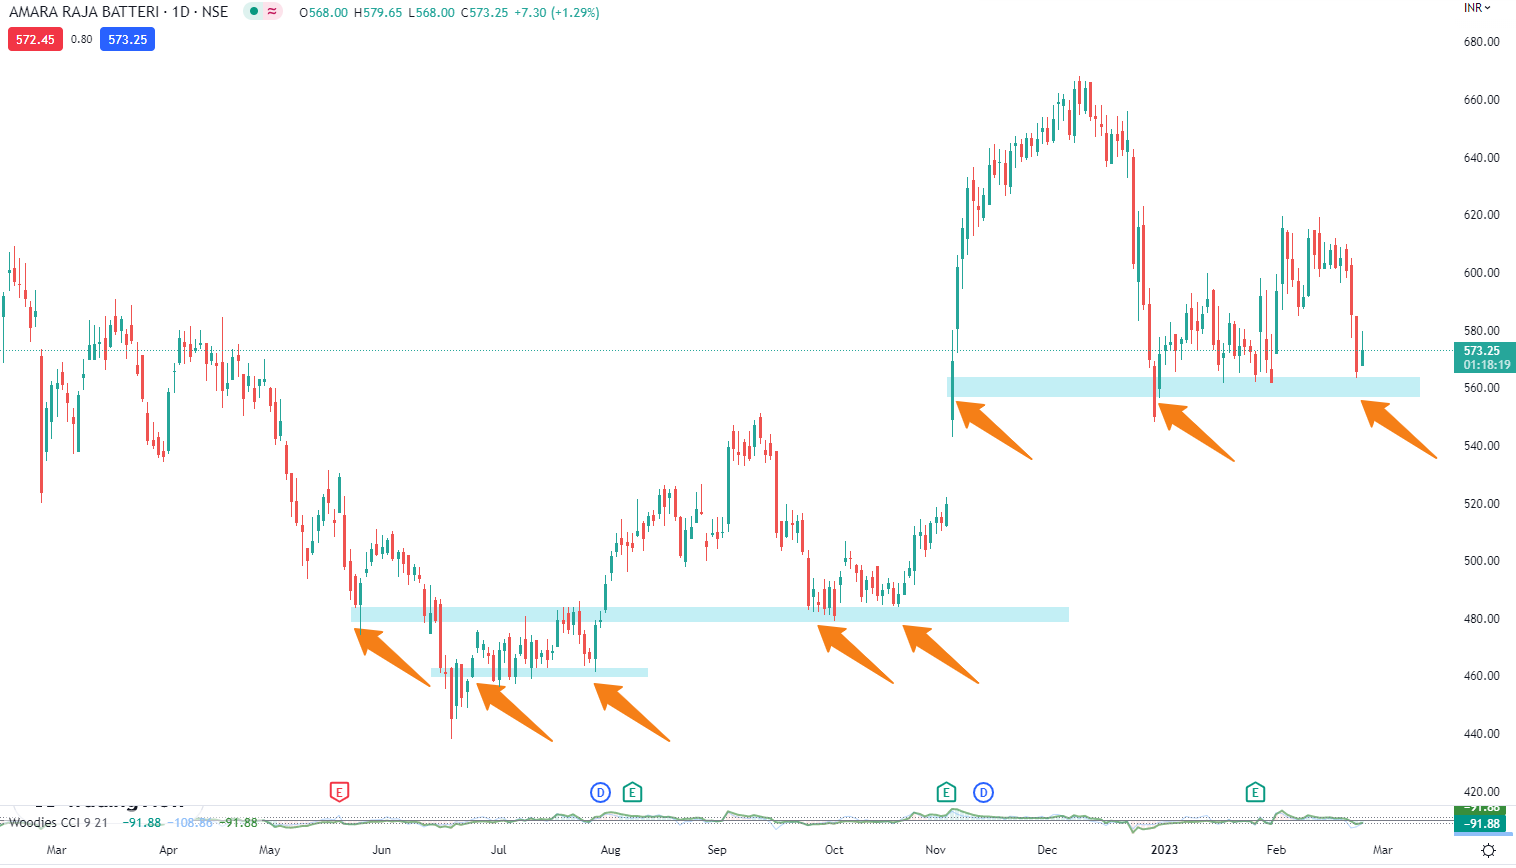
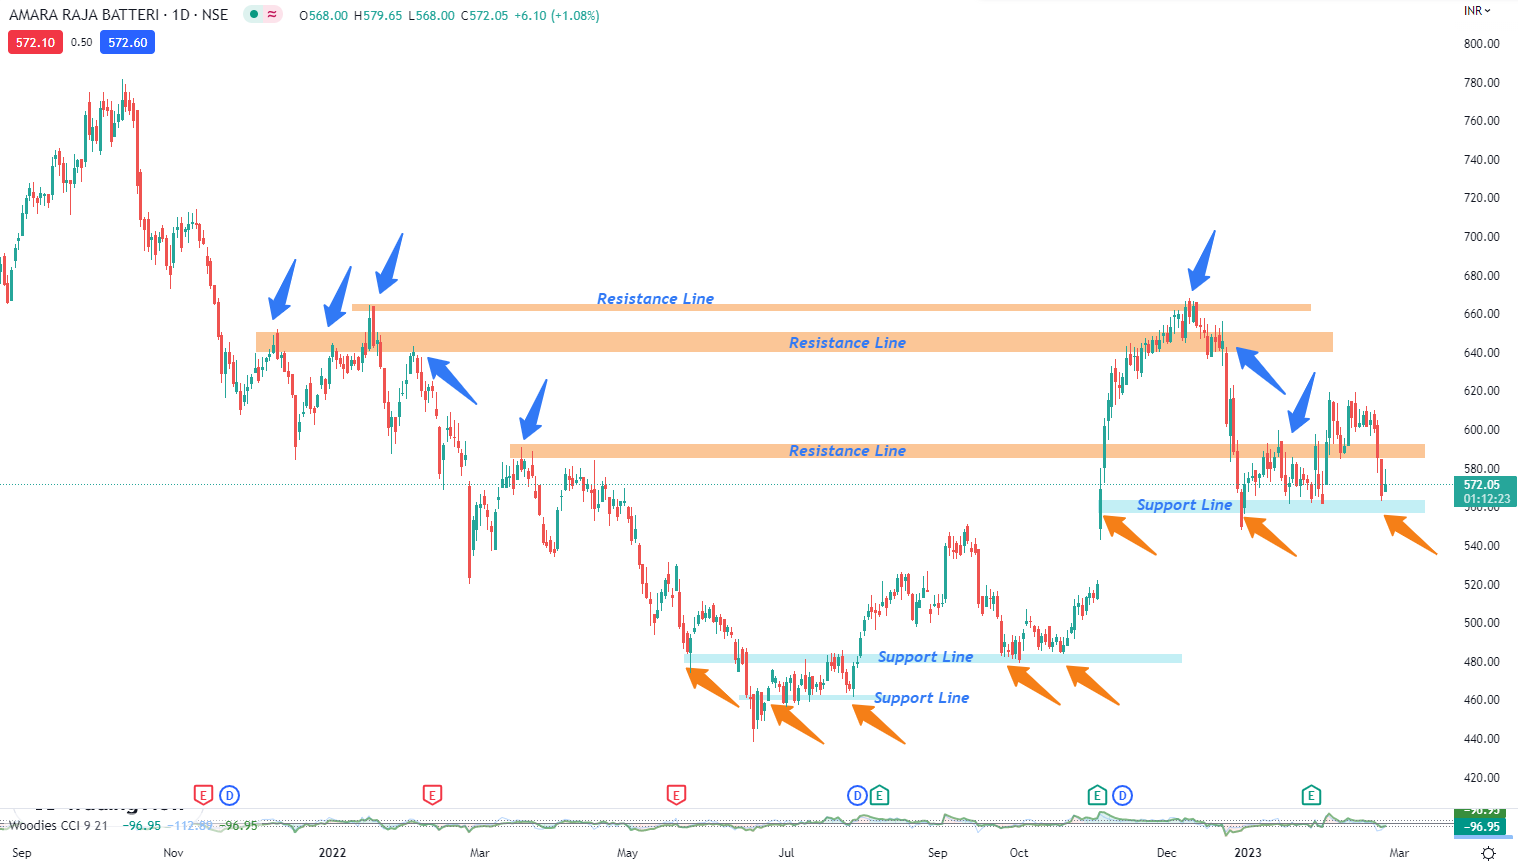
Find out the Support and Resistance Level –
To identify support and resistance levels, traders and investors use technical analysis tools and charting techniques. Here are some common methods for identifying support and resistance levels:
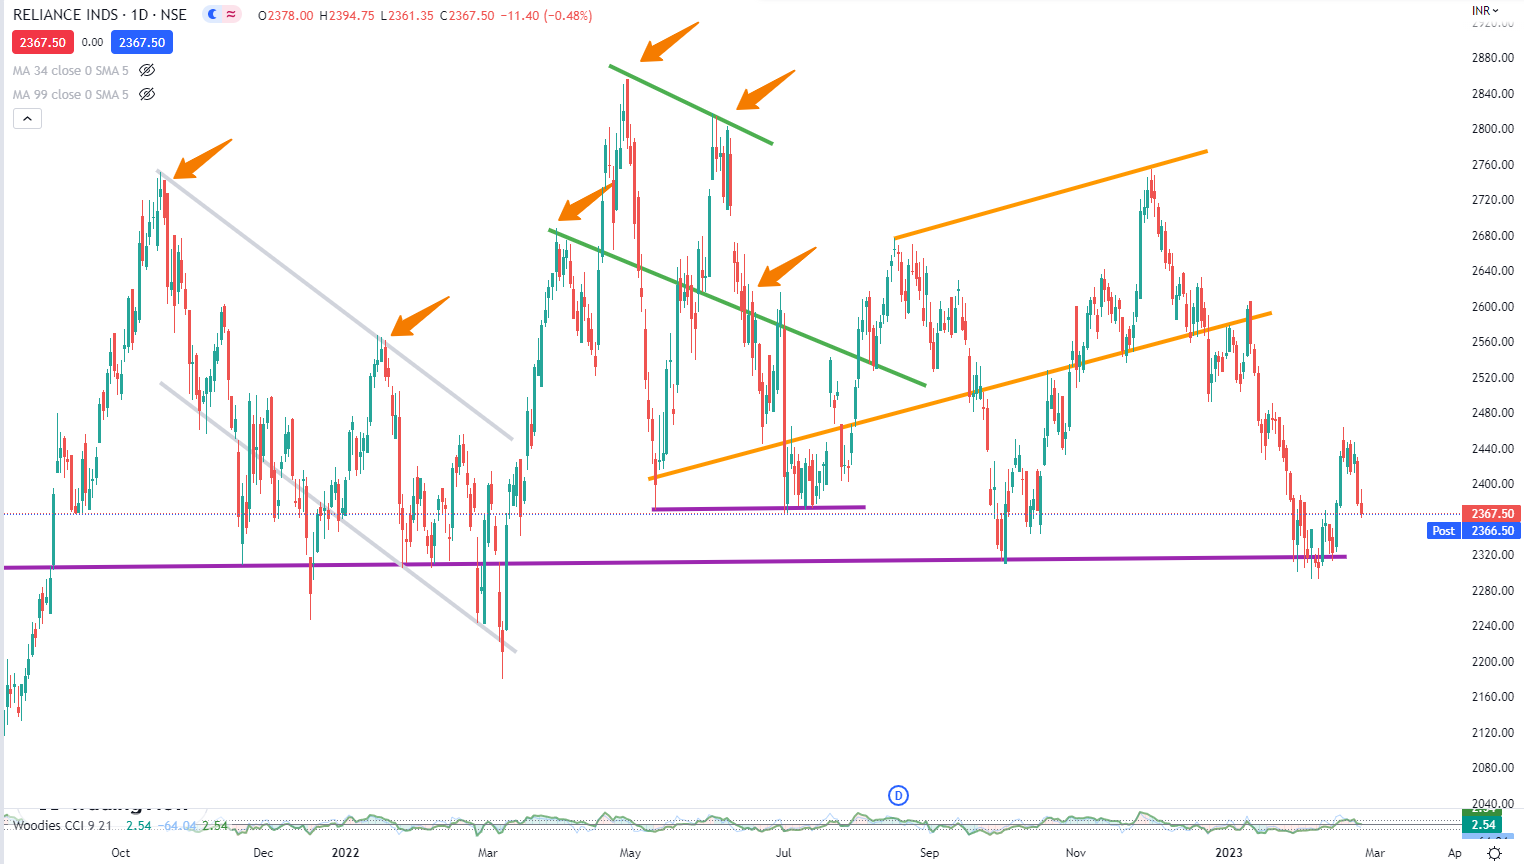
- Trend lines: Trend lines are drawn by connecting two or more significant highs or lows on a price chart. A trend line that connects two or more significant lows is considered a support line, while a trend line that connects two or more significant highs is considered a resistance line.
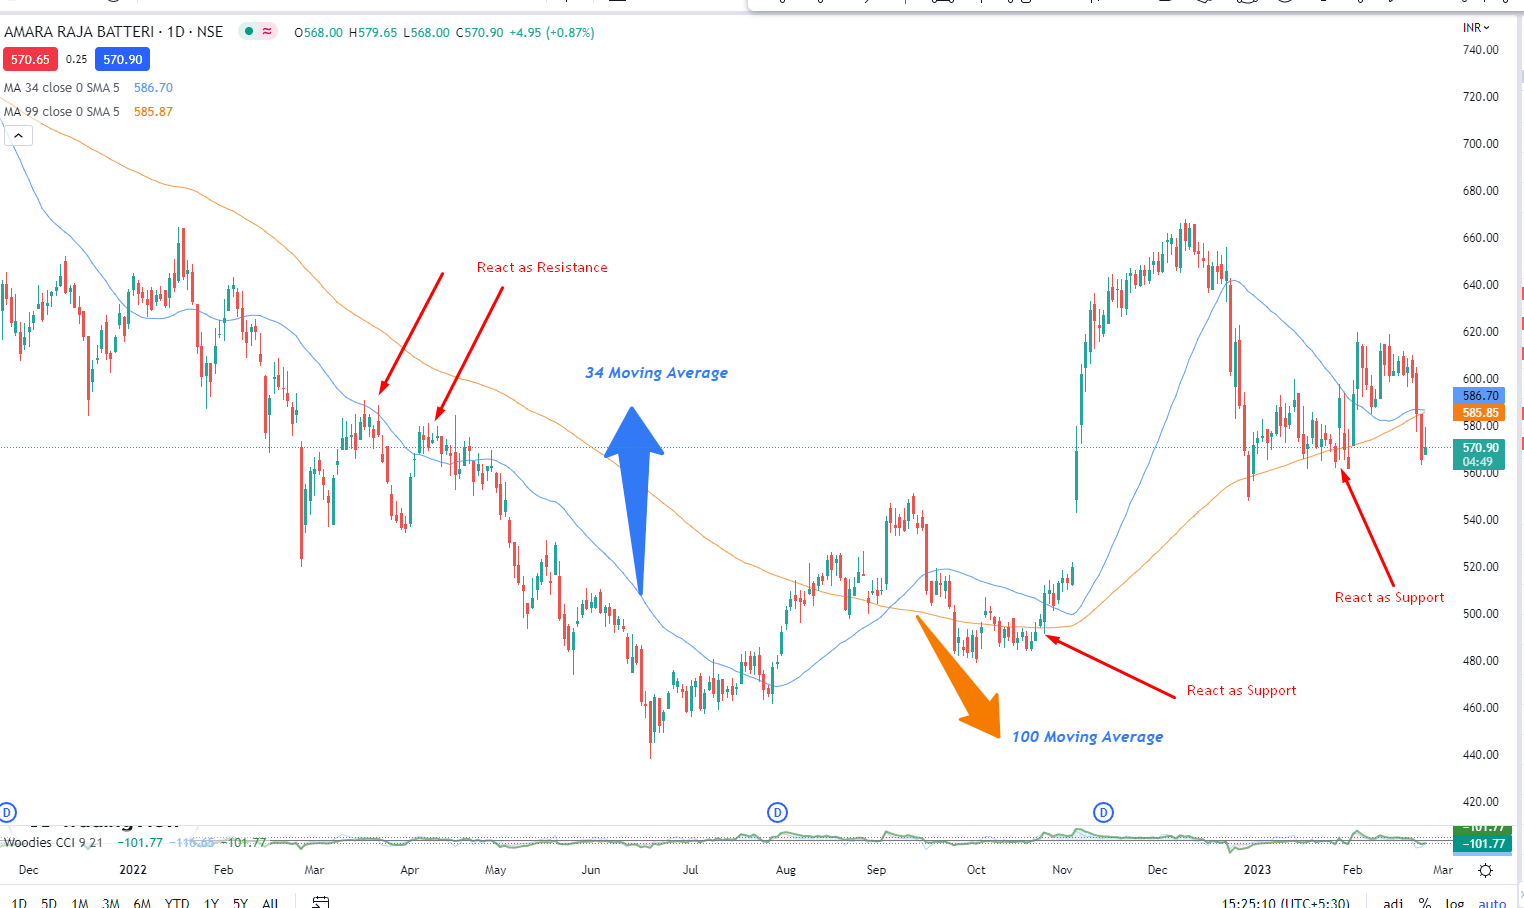
- Moving averages: Moving averages are used to smooth out price fluctuations and identify trends. Traders often use moving averages to identify support and resistance levels, with the assumption that prices will tend to bounce off the moving average.
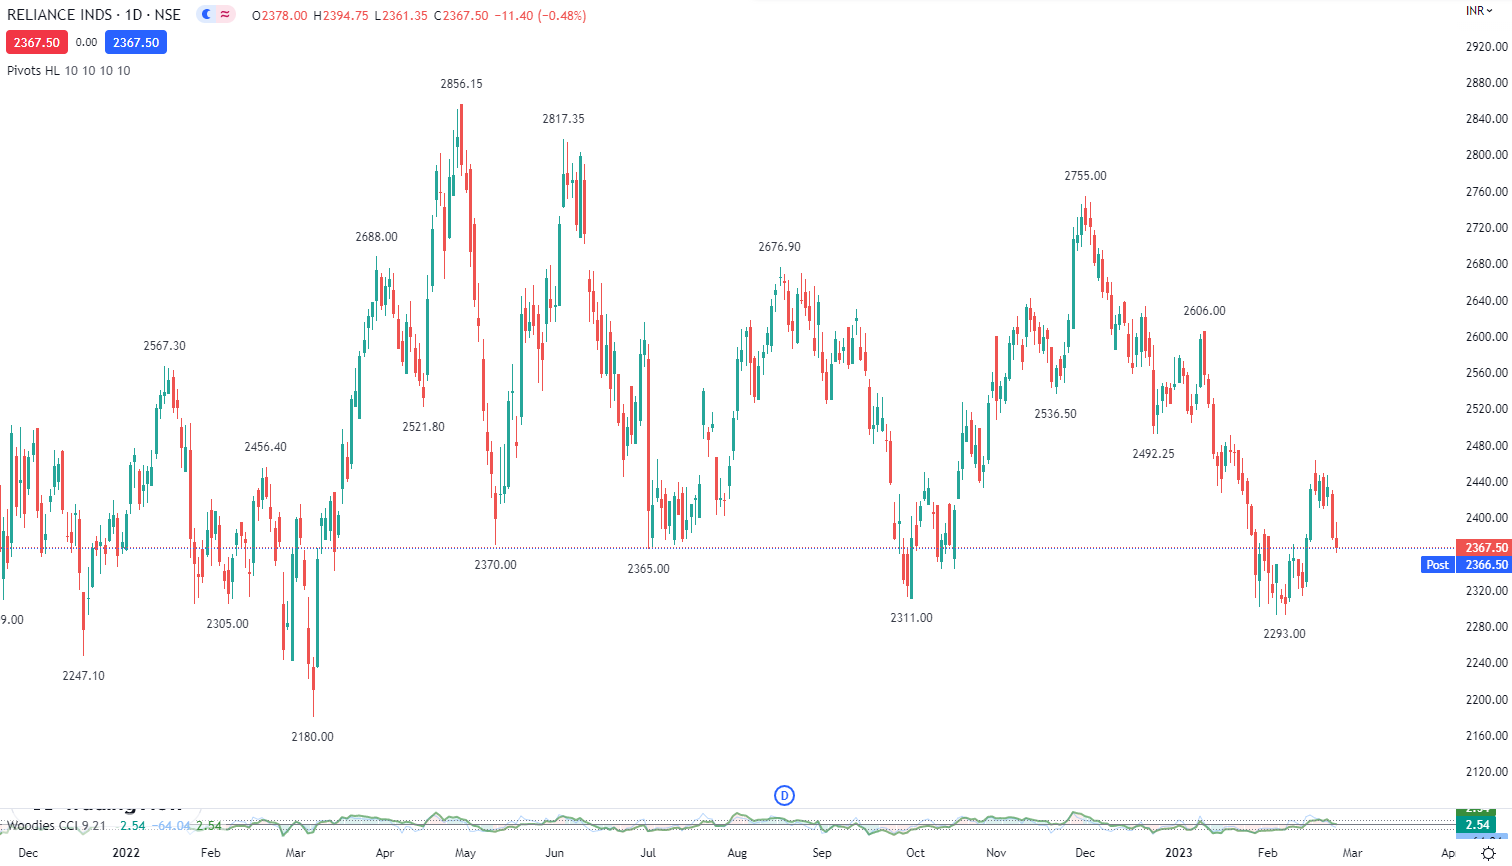
- Pivot points: Pivot points are levels used to identify potential support and resistance levels. Pivot points are calculated based on the previous day’s high, low, and closing prices, and can be used to identify levels where prices are likely to bounce or reverse.
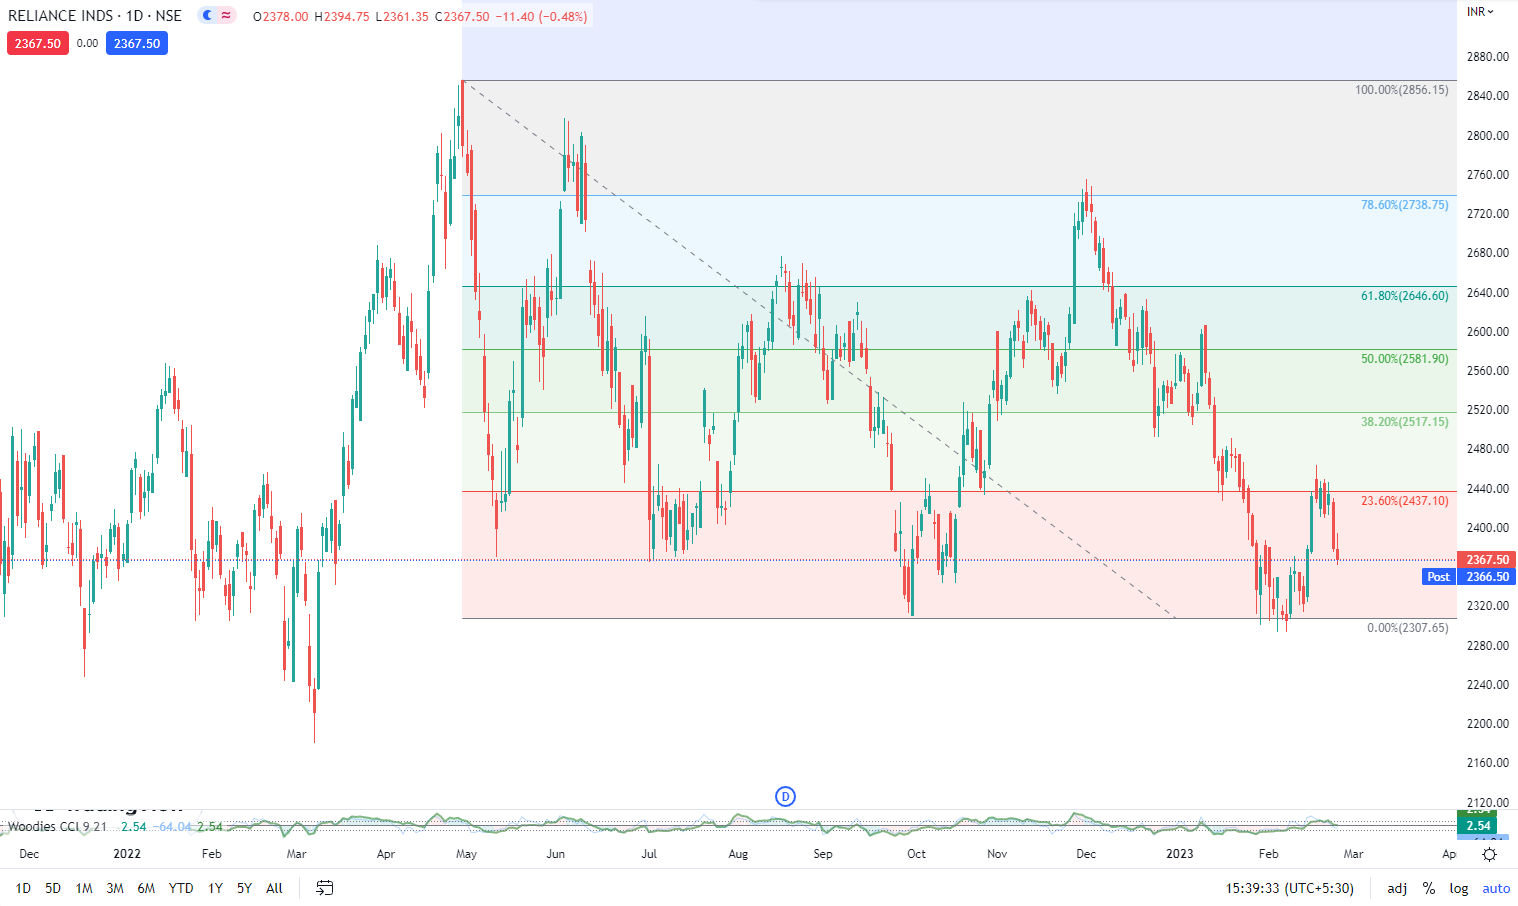
- Fibonacci retracements: Fibonacci retracements are based on the idea that prices tend to retrace a predictable portion of a move, after which they will continue in the original direction. Traders use Fibonacci retracements to identify potential support and resistance levels based on the Fibonacci ratios.
- Volume analysis: Traders and investors also use volume analysis to identify potential support and resistance levels. High trading volumes at a particular price level may indicate that it is a significant support or resistance level.
In summary, there are several methods for identifying support and resistance levels, including trend lines, moving averages, pivot points, Fibonacci retracements, and volume analysis. Traders and investors use these methods to identify potential buying and selling opportunities, set stop-loss orders and manage their trades.
For this type of technical chart, you can use the free website with some advanced customized indicators.
Next session we will discuss how and when we can buy and sell the stocks using this Support and Resistance.