
Here I am going to discuss the SRF Ltd. stock view.
SRF Ltd, also known as Shri Ram Fibres Limited, is an Indian multinational company that operates in various sectors such as chemicals, textiles, and packaging films. Established in 1970, SRF has grown to become a leading player in its industries. The company has a strong emphasis on sustainability and corporate social responsibility. They are committed to minimizing their environmental impact and have implemented various initiatives to promote sustainable practices across their operations. The current Market Capital is near 64,914 Cr. and its face value is Rs. 10.
Business Catagories
This SRF Ltd. Stock View stands with the company’s business category.
The company’s chemical business division is engaged in the manufacturing and marketing of industrial and specialty chemicals. SRF produces a wide range of chemicals used in various sectors such as refrigeration, air conditioning, pharmaceuticals, agrochemicals, and more. They have a strong focus on research and development to continuously innovate and offer high-quality products to their customers.
In the textiles sector, SRF is involved in the production of industrial yarns, technical textiles, and fabrics. The company caters to industries such as automotive, defense, agriculture, and construction, offering a diverse range of textile solutions.
SRF’s packaging films division is a prominent player in the flexible packaging industry. They manufacture and supply a wide range of films used for packaging applications, including food and beverages, personal care products, and pharmaceuticals. SRF’s packaging films are known for their durability, barrier properties, and sustainability.
Business Area
SRF Ltd has a global presence with manufacturing facilities and offices in India, Thailand, South Africa, and Dubai. They have a widespread distribution network that enables them to serve customers worldwide. The company’s commitment to quality, innovation, and customer satisfaction has earned them a strong reputation in the market.
Overall, SRF Ltd is a diversified company operating across multiple sectors and has established itself as a leader in chemicals, textiles, and packaging films. With a focus on sustainability and a customer-centric approach, SRF continues to drive growth and expand its presence in both domestic and international markets.
SRF Ltd. Stock View (Financial Report)
At a glance, I am going to show you the SRF Ltd. Stock View which is based on financial reports like quarterly results and profit & loss.
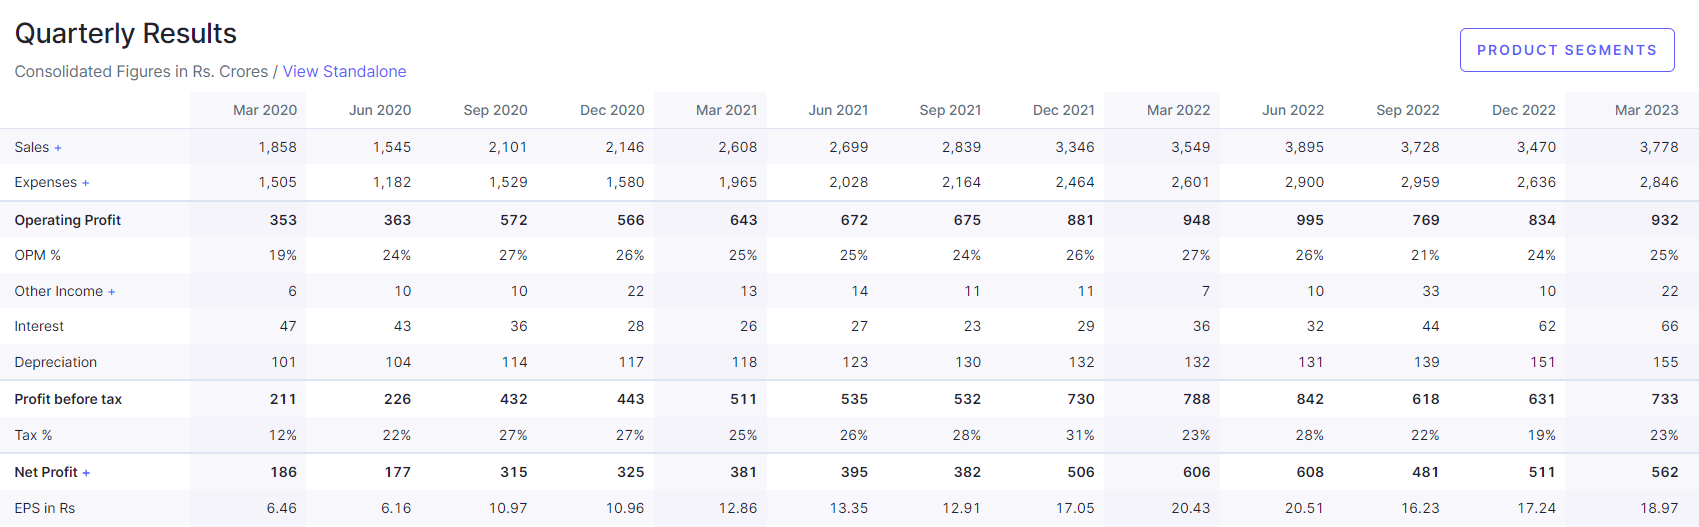
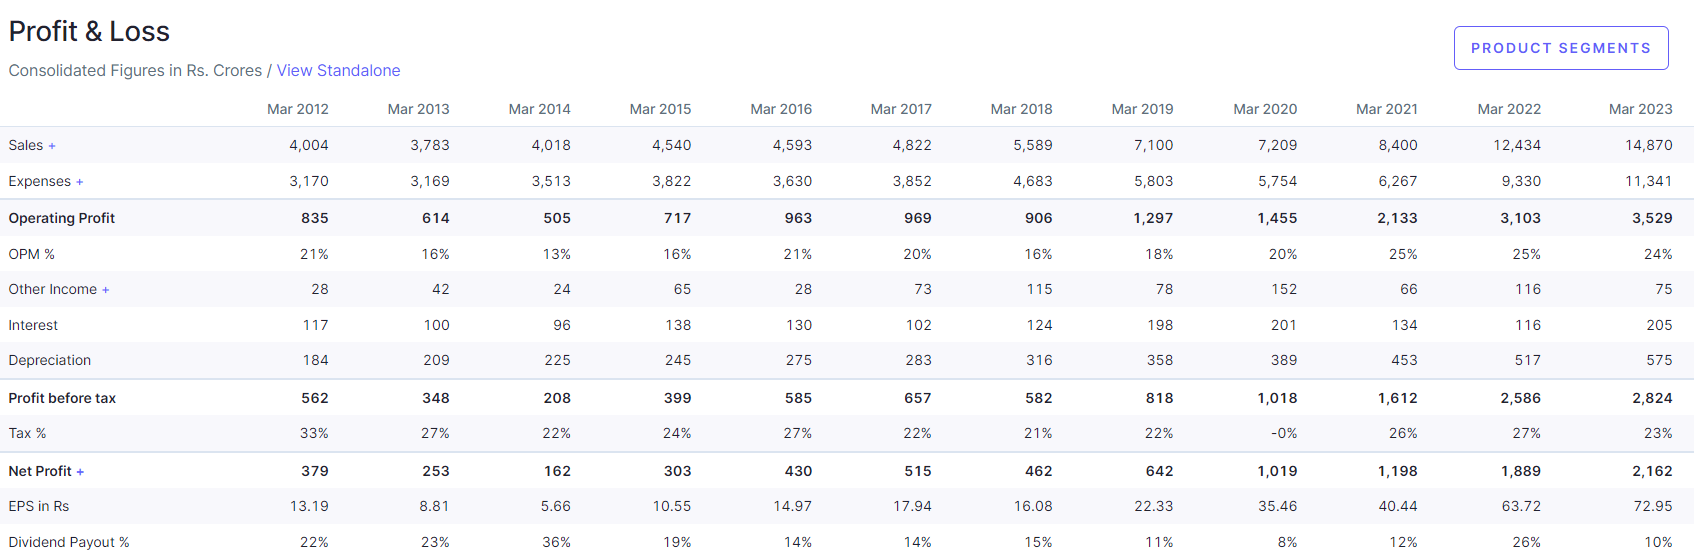
This above information is taken from here. You can also check here for more information about SRF.
SRF Ltd. Stock View (Technical Report)
Why I am going to choose this stock for discussion. As you know the stock very well. But I still believe that you can not know the business background. So, please go through the first section to know about the company’s background like business area and business categories. Now all the projection is based on the technical chart which I saw on this stock. First, show you the monthly chart. Please look at the chart.
Monthly Chart
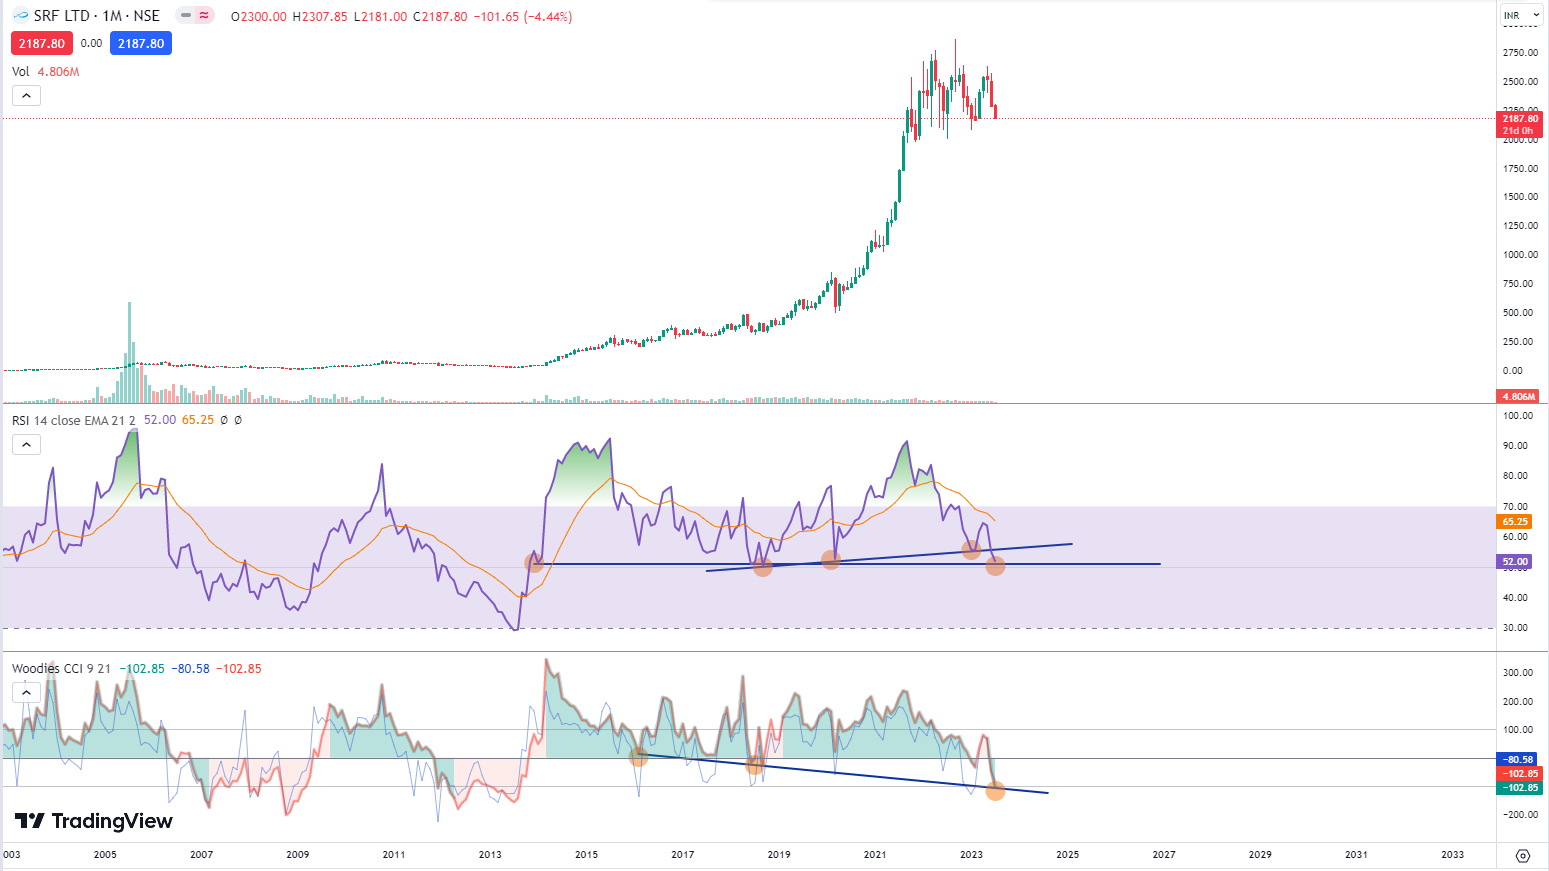
Above this chart, you can see the long run from 2014 when the price was at Rs. 40. Now the price is near 2200. Do not calculate the percentage of return on the investment. Past strongly means past. So, come back to the present scenario. Look at the RSI (Relative Strength Index) first. Some support levels arise at this level which is obviously monthly basis. Today is July 2nd week. So we can not judge the closing and can not wait for the monthly closing. 2ndly, CCI / woodies indicator also has some support zone areas in this area. But again the same thing is that this is a monthly basis chart. So, what will be the conclusion of this chart ???
The SRF Ltd. monthly chart indicated a strong support area nearby the current trading zone. So, it means that it can hold the fall and start the accumulation zone for further trading.
Weekly Chart
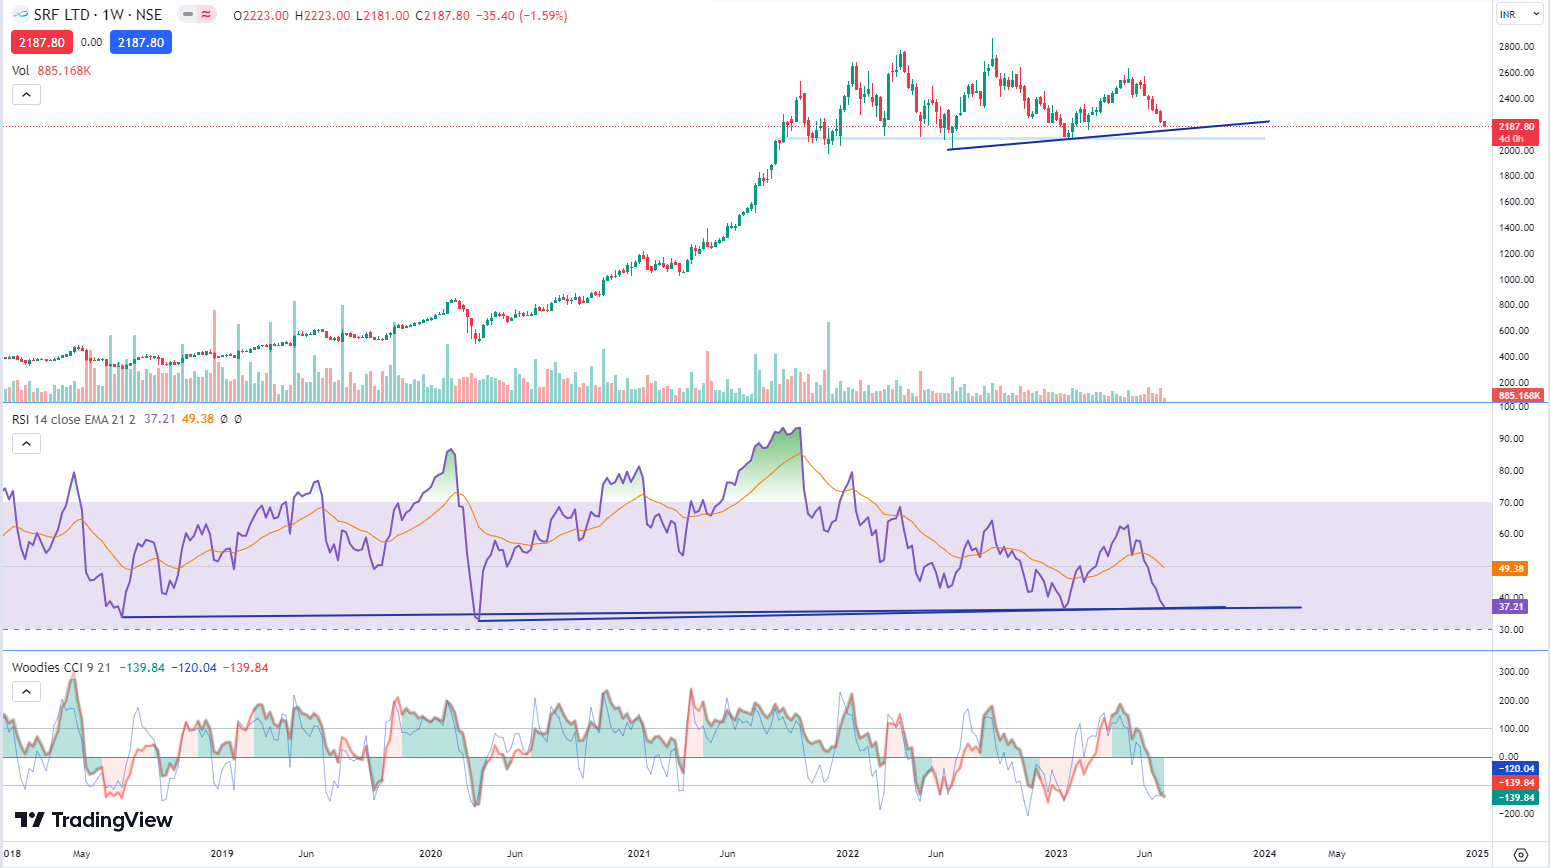
This is a very much interesting chart for me. Here, I can predict two things. One is a strong bottom point that stands near the 2080 to 2100 level zone. Another is RSI supporting point which is near the current trading zone. We are not GOD, so we can not predict the exact point. Today, I am writing this article because you have an opportunity to track the stock for this week and grab the scops. Do not pick at once. Pick the stock with dips. No more pain is possible from this range. If pain continues then you can see the monthly level as I discussed earlier paragraph.
Daily Chart
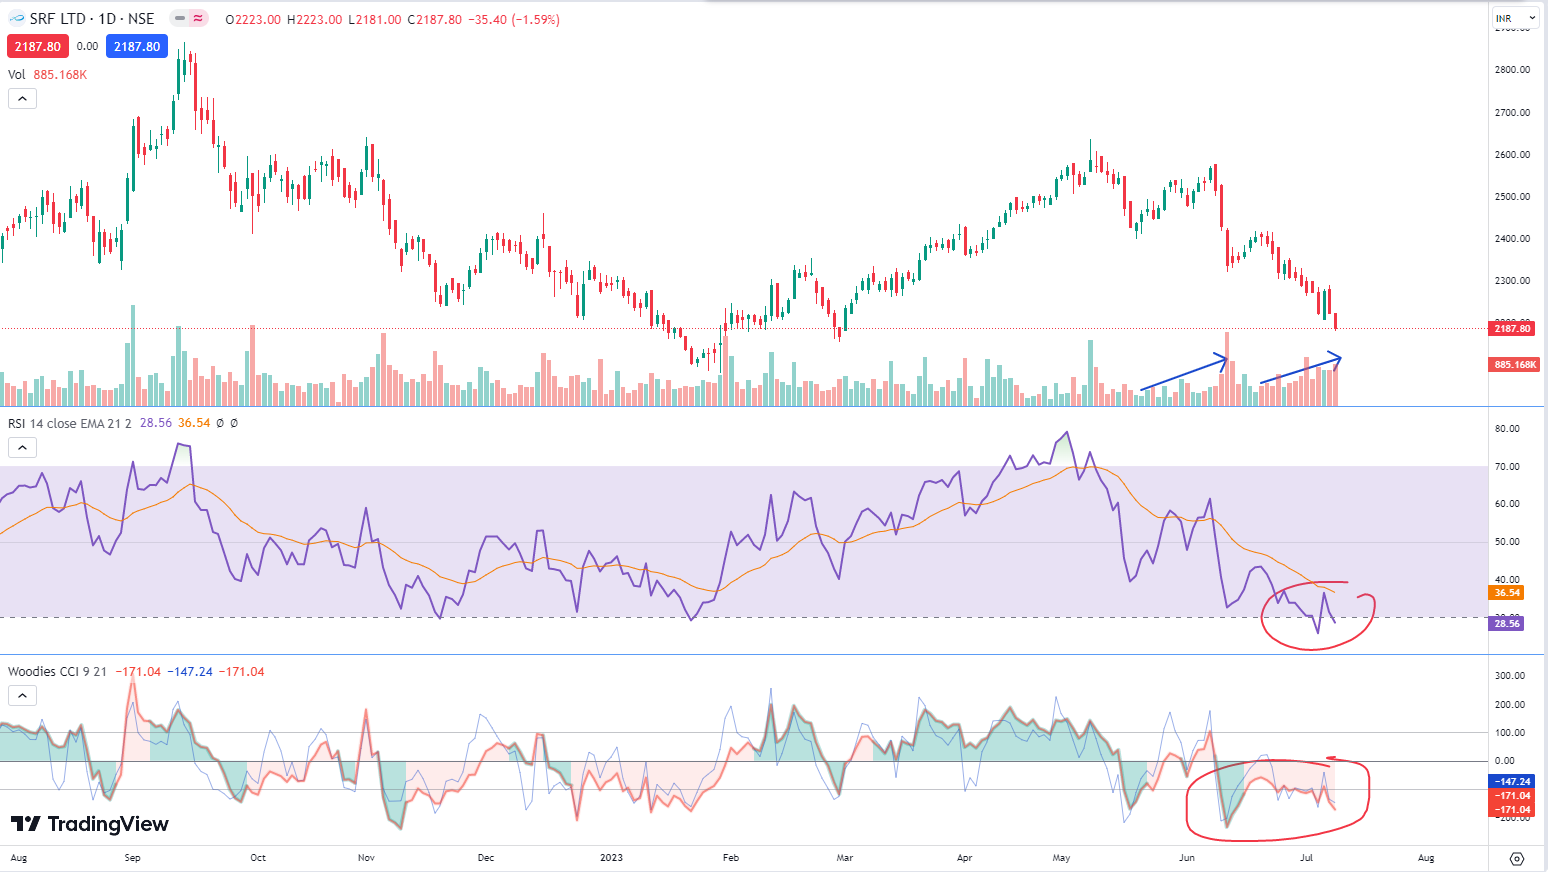
Now another timeframe chart which is a daily basis chart. Check out the chart. Both RSI and CCI show a negative hook. But in advanced analysis, you can predict one thing which is purely based on experience. CCI-positive divergence is possible within a week. Most probably CCI can not break the earlier lower hook level. If it happens then it will fail to create the positive divergence point. Another point is volume is also increasing.
Disclaimer
So, go with your calculation. I am not a GOD. I am not 100% correct. I do not know anything. Do your own research before any investment. I am not responsible for any profit or loss. I am just trying to help you filter the stock list for your wishlist.
For more content, you can check here.
You can follow my social platforms here.
500+ Youtube content. You can subscribe for more live content here.
2200+ Twitter Posting on live proof here.
Follow the Facebook page for updates.