RSI 9 tricks are the most popular for every trader. RSI or the Relative Strength Index, is a widely used technical indicator in the world of trading and investing. It offers valuable insights into the momentum and strength of a financial instrument’s price movement, making it an indispensable tool for traders. In this guide, we will explore nine effective tricks for harnessing the power of RSI in both intraday and positional trading strategies.
RSI Range concept:
RSI is a powerful indicator for any chart that is based on the stock market. It’s almost available on all the platforms and it’s easy to catch the figure. The range of RSI is 0 to 100 where 50 stands as middle or neutral. This article is for beginners and I will try to explain it simply.
Some people indicate that the above 70 area is for a bullish trend and below 30 is a bearish trend. But my thought is not based on it.
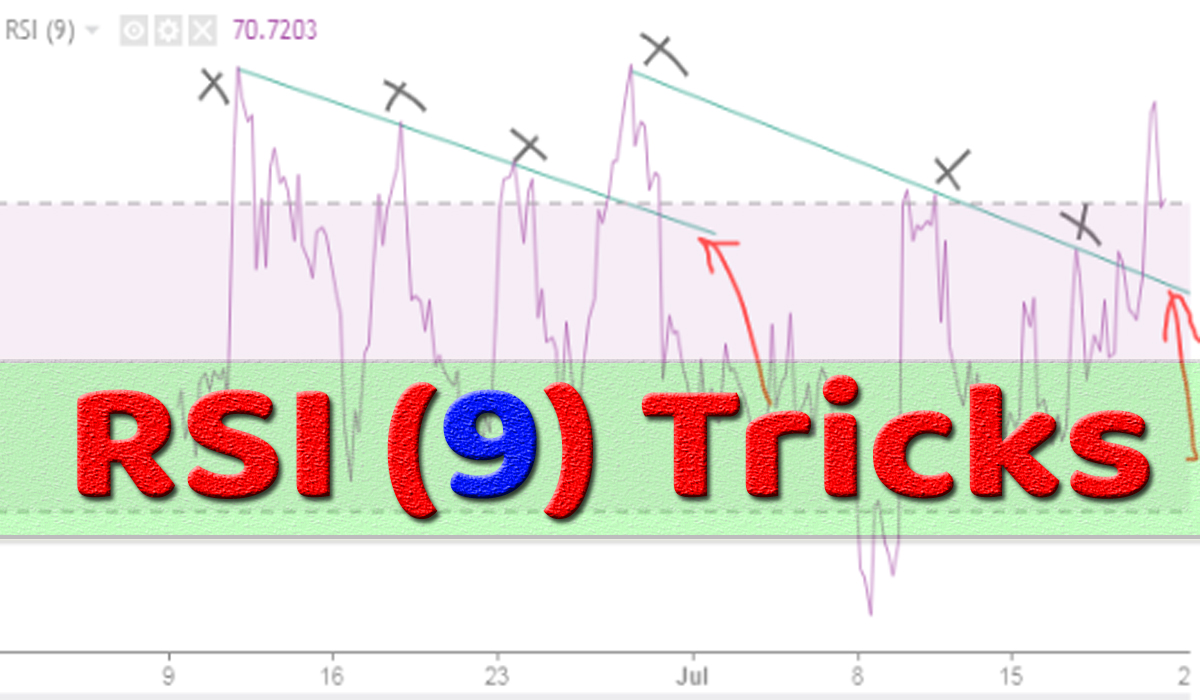
Just look at the zig-zag level. Where you can find out a trend. We have to find out the top to top hook and vice versa.
Don’t ask why we have to find out. Everyone needs the result. But practice finding the hooks first & use a line to connect them and wait for the breakout of the line as you can see on the chart.
Why different Parameters are used on RSI?
The default value of RSI is 14 which is a standard number as per many analysts. Some analysts use different numbers as per their output and better chart reading.
First, we have to understand the value of this parameter and how it works. In simple words, the last number of days of data or value average is for the mentioned parameters like 9, 14 and so on.
So, a small value can give you a major zig-zag view and a big value gives a flat zig-zag view.
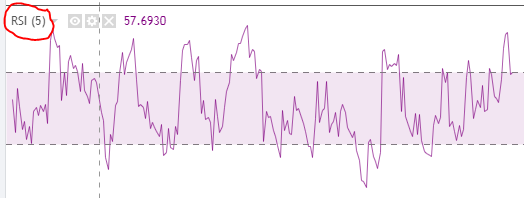
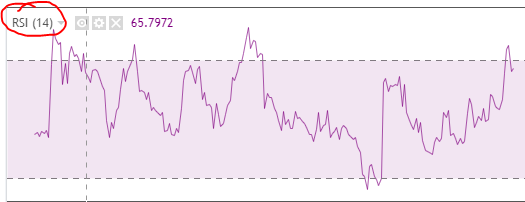
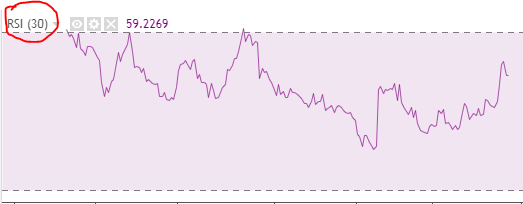
In the above pictures, you can clearly see the difference between the parameters. The above RSI chart is the same stock with different RSI parameter values.
How do RSI 9 tricks work?
RSI 9 tricks are basic and simple for everyone. You just have to draw a parallel line against the hook and count the top hook where your parallel line touches.
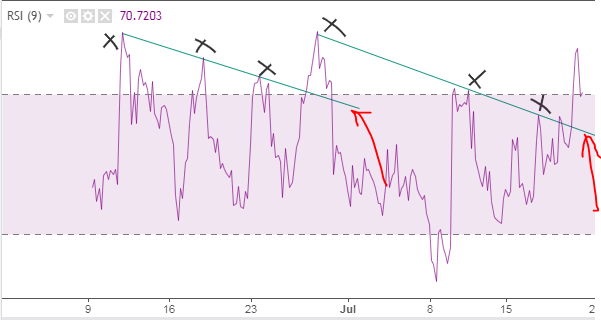
You can see the above image as an example.
In the 1st phase, you can see the three tops, which is one trending line.
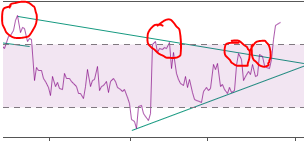
Now we have to find out or identify the cross where the trend line is breaking in the below picture. This is the most important RSI 9 tricks formula.
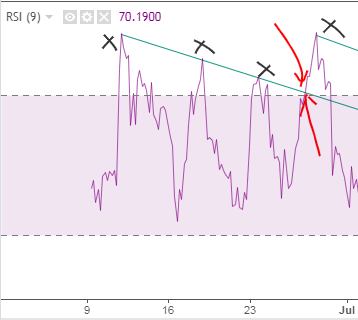
If the RSI crosses the line like in the above picture, you can enter it here as BUY. Now we can show you the price and its action.
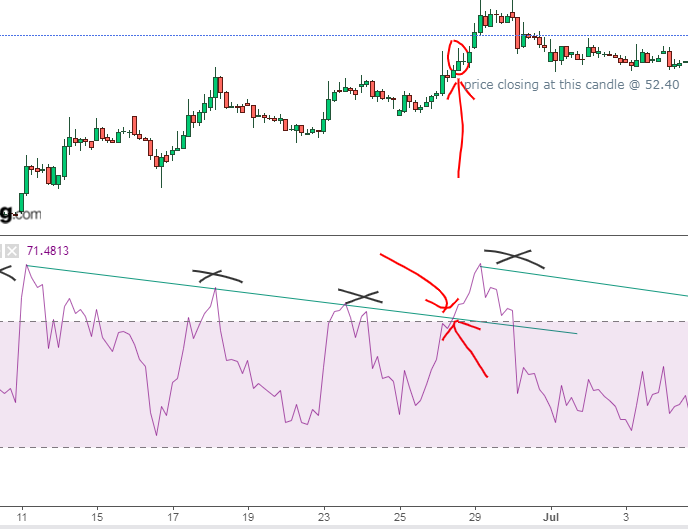
The price was 52.40 as per the chart, and it must be a closing candle with a confirmed trend line crossing.
Now the question is where the price has gone since taking the position on RSI 9 tricks.
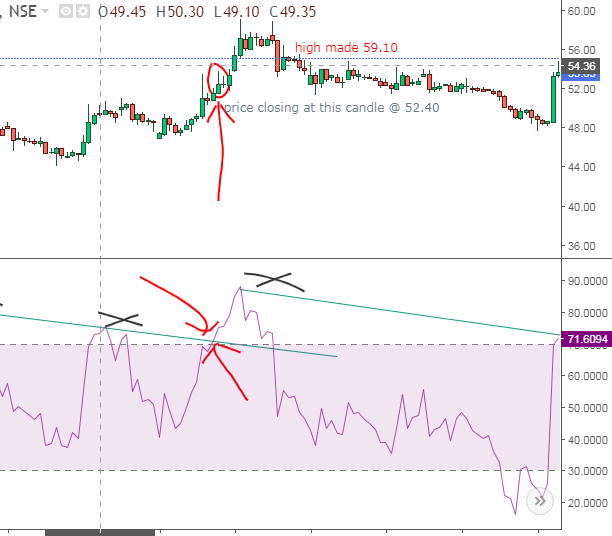
Boommmm……!!!
High made 59.10 from the breakout level was 52.40 which means nearly 12% return which is more than enough.
And how many candles do we have to wait for this type of return? On the chart, you can see 5-7 candles for this target, but still, you have to wait for a proper hook to exit your position.
I personally prefer 5-10% from investment, which is more than enough return when we calculate it on a yearly basis.
This chart time frame is 60 min & you can use this trick on any time frame and in any condition, which means on the BUY side and also the SELL side.
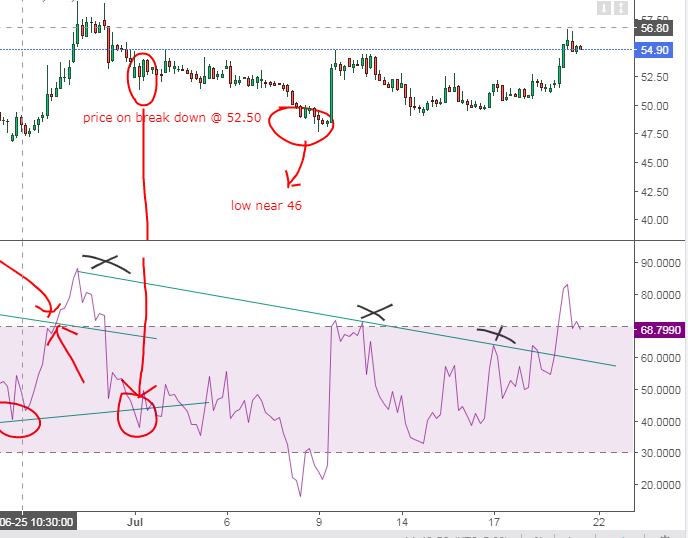
Here I also giving you a SELL side example which is based on the same theory. So, if you want to SELL on FAO script then you can also use this RSI tricks easily.
I will give you more examples with charts with different time frames. Please go through the charts and read to prepare yourself as a chart reader.
For more content, you can check here.
You can follow my social platforms here.
500+ YouTube content. You can subscribe for more live content here.
2200+ Twitter Posting on live proof here.
Follow the Facebook page for updates.