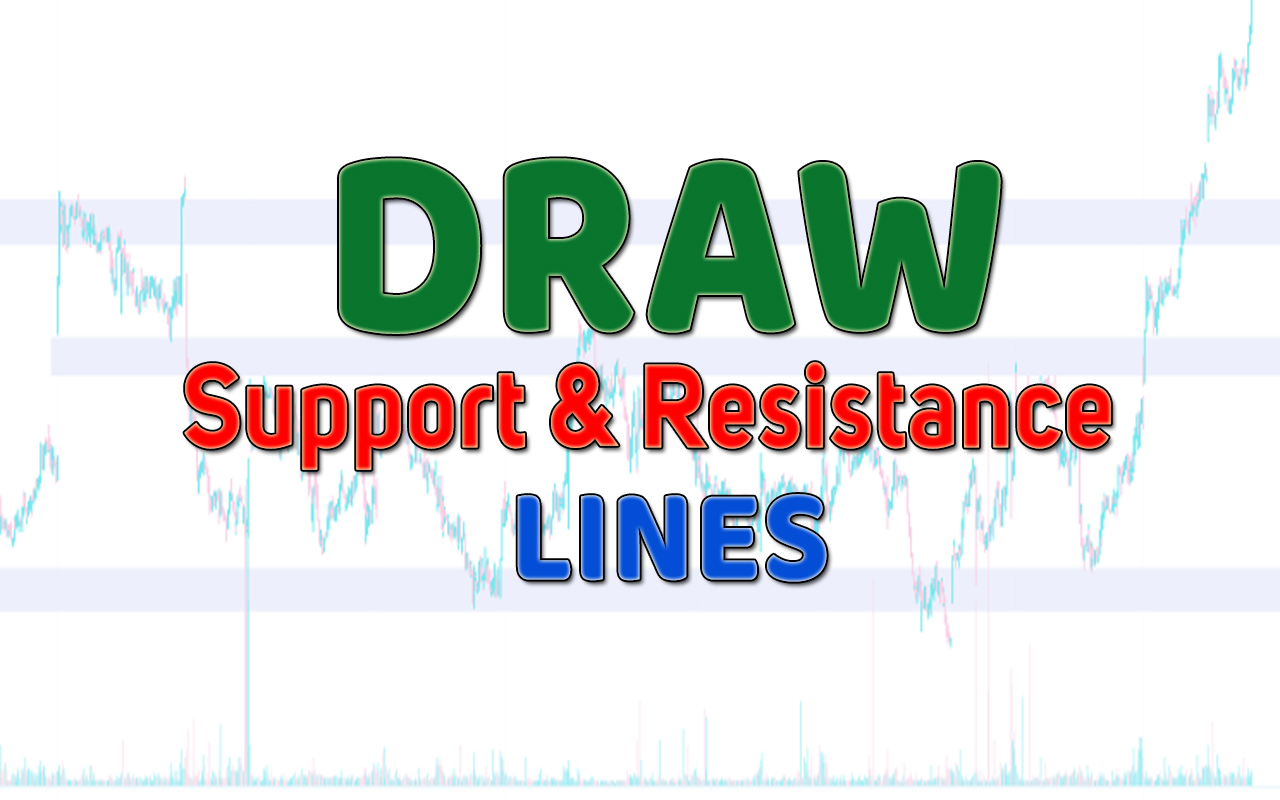
Learn how to draw support and resistance lines effectively to identify the key levels, predict price movements, and make informed trading decisions for trade. Improve your trading strategy with this comprehensive guide in 2023.
Support and resistance lines are essential tools for traders and investors in analyzing financial markets. Whether you’re a seasoned trader or a beginner, understanding how to draw these lines can significantly enhance your trading strategy. In this article, we will discuss the importance of support and resistance lines, and their definition, and provide a step-by-step guide on how to draw them effectively for trading.
Introduction
Have you ever wondered why prices in the financial markets often react or reverse at specific levels?
The answer lies in support and resistance lines. These lines represent key levels where buyers and sellers converge, influencing price movements. By identifying and drawing these lines, you can gain valuable insights into the market dynamics and make informed trading decisions.
Support lines are horizontal lines drawn below price levels where buying pressure outweighs selling pressure, preventing prices from falling further. Resistance lines, on the other hand, are horizontal lines drawn above price levels where selling pressure exceeds buying pressure, preventing prices from rising further. Understanding these lines can help you scale the market sentiment and predict potential reversals or breakouts.
Benefits of Drawing Support and Resistance Lines
Drawing support and resistance lines offers several benefits to traders and investors. Let’s explore the key advantages of incorporating them into your technical analysis:
Identifying Key Levels
Support and resistance lines help identify significant price levels where market participants have previously shown interest. These levels act as reference points, indicating areas of potential buying or selling pressure.
Predicting Price Movements
When the price approaches a support or resistance line, it often reacts to these levels. By drawing these lines accurately, you can anticipate potential price reversals, breakouts, or consolidations.
Making Informed Trading Decisions
Support and resistance lines provide valuable insights into the market’s behavior. By considering these levels alongside other technical indicators, you can make more informed decisions when entering or exiting trades.
Steps to Draw Support and Resistance Lines
To draw support and resistance lines effectively, follow these step-by-step instructions:
Identifying Swing Highs and Swing Lows:
Look for significant peaks and troughs on the price chart. These points represent swing highs (peaks) and swing lows (troughs). Connect the swing highs and swing lows to draw trendlines.

Drawing Trendlines:
Trendlines are diagonal lines that connect swing highs or swing lows. They provide an additional layer of support or resistance, offering insights into the market’s direction and potential breakout or reversal points.

Confirming Support and Resistance Levels:
It’s important to note that drawing support and resistance lines is not an exact science. Market dynamics can change, and it’s essential to adapt and adjust your lines accordingly. Regularly review and update your lines based on new price developments.

Suggestions for Effective Support and Resistance Line Drawing
Here are some additional tips to enhance your support and resistance line-drawing skills:
Using the Multiple Timeframes:
Analyzing support and resistance levels across different timeframes can provide a broader perspective and validate their significance.


Considering Volume and Price Action:
Pay attention to trading volume and price patterns around support and resistance levels. Higher trading volume and significant price movements can indicate stronger levels.
Monitoring News and Events:
Stay informed about market news and events that could impact the support and resistance levels. Unexpected announcements or economic data releases can influence price reactions.
By incorporating these tips into your technical analysis, you can improve the accuracy of your support and resistance lines.
Conclusion
In conclusion, drawing support and resistance lines is a fundamental skill for traders and investors. These lines provide insights into key price levels, help predict price movements, and enable informed trading decisions. By identifying swing highs and swing lows, drawing trendlines, and confirming support and resistance levels, you can enhance your technical analysis capabilities and improve your trading strategy. Remember, practice and experience are vital for mastering the art of drawing support and resistance lines. Continuously refine your skills and adapt your analysis to changing market conditions. With time, you’ll develop a keen eye for spotting crucial levels and utilizing them to your advantage.
Frequently Asked Questions (FAQs)
Q1: How do support and resistance lines impact trading decisions?
Support and resistance lines act as reference points, indicating areas of potential buying or selling pressure. Traders use these lines to understand market sentiment, predict price reversals, and make informed trading decisions.
Q2: Can support or resistance lines be broken?
Yes, support or resistance lines can be broken. When a line is broken, it may indicate a shift in market dynamics and the potential for a new trend or direction.
Q3: What other technical indicators should I consider alongside support and resistance lines?
Support and resistance lines are often used in conjunction with other technical indicators such as moving averages, oscillators, or chart patterns. Combining these tools can provide a more comprehensive analysis of the market.
Q4: Are support and resistance lines effective for all financial markets?
Support and resistance lines are applicable to various financial markets, including stocks, forex, commodities, and cryptocurrencies. However, their effectiveness may vary based on the market’s liquidity and volatility.
Q5: How often should I update my support and resistance lines?
It’s recommended to review and update your support and resistance lines regularly, especially when there are significant price movements or new market developments. Adaptability is crucial for maintaining accurate analysis.
Remember, mastering the art of drawing support and resistance lines requires practice and continuous learning. By incorporating these lines into your technical analysis, you can enhance your trading strategy and increase your chances of success.
For more content, you can check here.
You can follow my social platforms here.
500+ Youtube content. You can subscribe for more live content here.
2200+ Twitter Posting on live proof here.
Follow the Facebook page for updates.


