India’s Present Financial Snapshot
India entered 2026 as the world’s fourth-largest economy by nominal GDP, having surpassed Japan in 2025. Backed by robust domestic consumption, structural reforms, and a strengthened financial system, India continues to post growth figures that outpace every other major economy in the G20.
The Reserve Bank of India revised its GDP growth forecast upward to 7.3% for FY2025–26, with the December quarter delivering an impressive 7.8% expansion. Inflation hit historic lows — averaging just 1.7% through most of 2025 — giving policymakers room to cut the repo rate to 5.25%. Foreign exchange reserves stood at a robust USD 701.4 billion as of January 2026, providing approximately 11 months of import cover.
In August 2025, S&P upgraded India’s sovereign credit rating from BBB– to BBB — its first such upgrade in 18 years. India and the EU also reached a landmark Free Trade Agreement in January 2026 after 20 years of negotiations.
KEY OF INDIA ECONOMY 2026 INDICATORS
|
GDP Growth FY26 |
Forex Reserves |
CPI Inflation |
|
7.6% |
$701 Billion |
1.7% |
|
Revised upward |
~11 months cover |
Decade-low average |
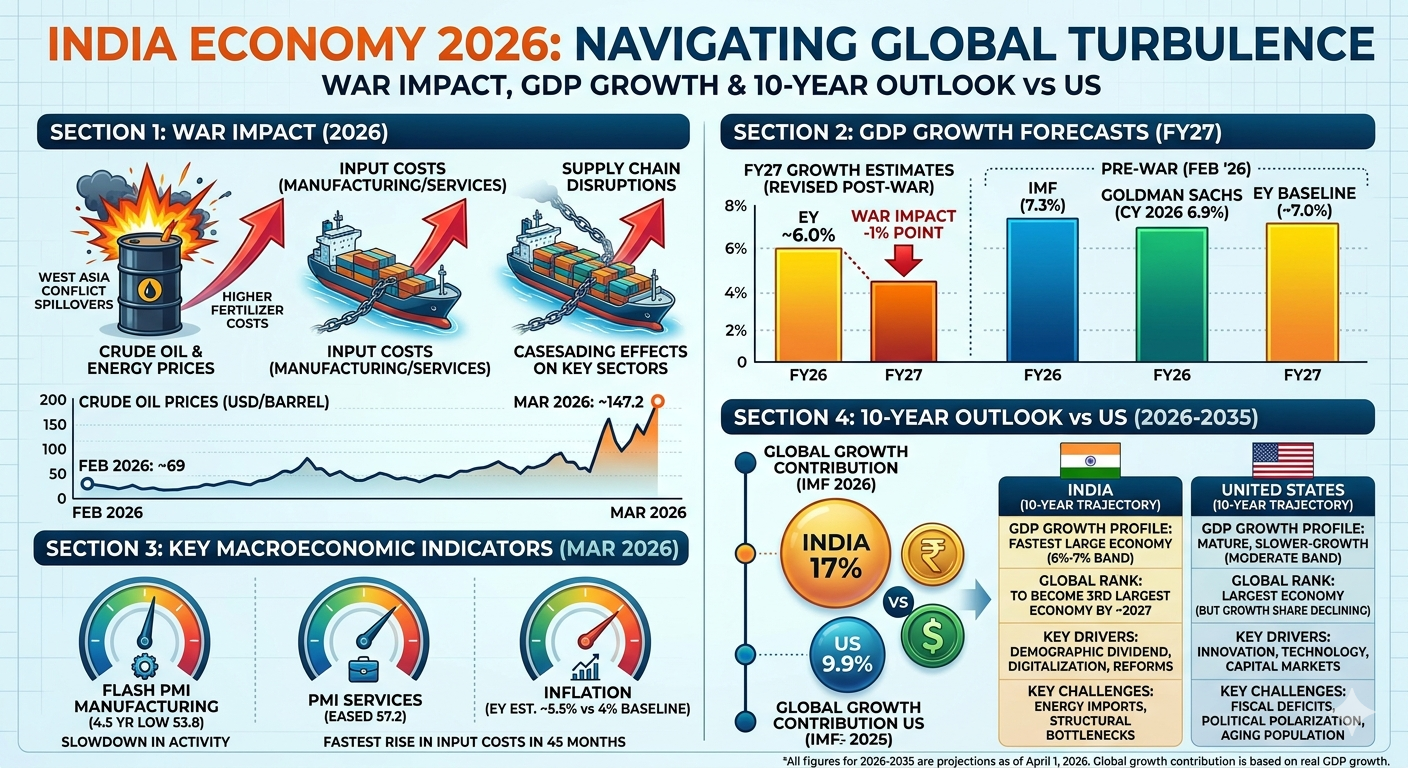
War Impact on India’s Financial Markets
India’s financial landscape in 2025–26 has been shaped by two major geopolitical conflicts: the India–Pakistan military standoff (Operation Sindoor, May 2025), and the escalating US–Israel–Iran conflict that triggered severe disruptions in the Strait of Hormuz.
⚠️ Key Alert: Iran’s blockade of the Strait of Hormuz reduced ship transits from a normal 200–300 per week to nearly one — a near-complete halt. As the world’s third-largest crude oil importer, India faces acute energy vulnerability.
DIRECT MARKET IMPACTS
|
Impact Area |
What Happened |
Type |
|
Nifty 50 |
Corrected ~9%, $240B wealth erased |
❌ Negative |
|
Sensex |
Slid 6.5% over three weeks |
❌ Negative |
|
Indian Rupee |
Hit record low ₹93.28/USD |
❌ Negative |
|
FII Capital Flows |
$18 Billion outflows in 2025 |
❌ Negative |
|
India VIX |
Surged 40% since April 15, 2025 |
❌ Negative |
|
Crude Oil Prices |
Spiked; ₹300–500B subsidy risk |
❌ Negative |
|
Steel & Metals |
Prices rose ₹7,000/tonne |
✅ Positive |
|
Defence Stocks |
Sharp rally; multi-year growth |
✅ Positive |
|
IT & Pharma Exports |
Rupee fall boosted competitiveness |
✅ Positive |
|
Fertiliser Supply |
Gulf disruption threatened urea |
⚠️ At Risk |
💡 Silver Lining: Domestic Institutional Investors (DIIs) and retail participants stepped in as net buyers during FII exits, maturing India’s capital markets. Post-Russia–Ukraine data showed markets rebounded with Auto (+45%), Metals (+35%), and Financials (+30%) over the following three months — a pattern analysts expect to repeat.
Import & Export: The Trade Engine of Growth
India stands as the world’s 7th-largest importer and 10th-largest exporter as of 2025. Services exports have become the dominant pillar of resilience, while goods exports have found alternative markets despite US tariff pressure.
Key Trade Developments (2025–26):
US Trade Deal — Reciprocal tariffs on Indian goods reduced from 25% to 18% in February 2026. Goldman Sachs estimates this adds 0.2 percentage points to GDP growth annually.
India–EU Free Trade Agreement — Signed January 2026 after 20 years of negotiations. Lowers tariffs on 90%+ of goods. Takes effect early 2027.
Services Exports Surge — Rose 8.65% to USD 270.06 billion (Apr–Nov 2025), narrowing the current account deficit from 2.2% to just 1.3% of GDP.
Alternative Markets — Despite US tariffs, India redirected textiles, marine products, gems, auto components, and leather goods to new markets successfully.
✅ Trade Balance Outlook: Current Account Deficit has narrowed sharply. Supported by $135.4B in remittances (world’s largest), $270B+ in services exports, and strong FDI momentum in H1 FY26.
India vs. the World: 5–10 Year Growth Outlook
GDP GROWTH RATE COMPARISON (2026–2027)
Country │ Projected Growth Rate │
├──────────────┼───────────────────────────────────────────┤
│ 🇮🇳 India │ ██████████████████████ 6.8 – 7.6% │
│ 🇮🇩 Indonesia│ ████████████████ 5.0% │
│ 🌍 World Avg │ ██████████ 3.3% │
│ 🇨🇳 China │ █████████ 3.0% │
│ 🇺🇸 USA │ ██████ 2.1% │
│ 🇬🇧 UK │ ████ 1.5% │
│ 🇩🇪 Germany │ ████ 1.2% │
│ 🇯🇵 Japan │ ███ 1.0% │
└──────────────┴───────────────────────────────────────────┘
Projected Economic Milestones
│ 2026 — NOW │
│ 4th largest economy (~$4.2T). GDP growth 7.2–7.6%. S&P upgrade │
│ to BBB. India–EU FTA signed. US–India trade deal at 18% tariff. │
│ Fastest-growing G20 economy for 3rd consecutive year. │
│ 2027–2028 — 3RD LARGEST ECONOMY │
│ India overtakes Germany. GDP crosses $5.2 trillion. India–EU FTA │
│ takes effect. Private capital expenditure cycle unlocks. │
│ 2030 — $7.3 TRILLION ECONOMY │
│ Working-age population overtakes China. Digital economy = 20% GDP. │
│ Government debt-to-GDP falls to ~75.8%. Solar target: 500 GW. │
│ 2035 — CHALLENGING THE US IN PPP TERMS │
│ India adds $2.1T in nominal GDP (2026–2030), ranked 3rd globally. │
│ Pharma sector hits $130B. Nuclear capacity rises to 22.5 GW. │
│ 2038 — SURPASSING THE US (PPP BASIS) │
│ At 6.5% vs US 2.1% growth, India reaches $34.2T (PPP). Lowest │
│ govt debt trajectory in G5. US debt rises past 120% of GDP. │
India’s Structural Advantages vs. Major Economies:
🇨🇳 vs. China — India’s growth is 70% consumption-driven vs. China’s 40%. China faces ageing population (median age 40+), 60% household debt, saturated housing market. India’s demographic window is just opening.
🇺🇸 vs. USA — US carries $30+ trillion in national debt with ~70% due for refinancing by 2030. India’s debt-to-GDP is falling to 75.8% while the US is rising past 120%.
🇩🇪🇯🇵 vs. Germany & Japan — Both face demographic decline and low growth (1–1.2%). Japan’s debt-to-GDP exceeds 400%. India will overtake both in nominal GDP by 2028.
| Sector | Today | 2030 Target | Key Driver |
|---|---|---|---|
| Pharmaceuticals | $50B | $130B | Generic leader |
| Digital Economy | $402B / 11.7% of GDP | 20% of GDP | UPI, AI, SaaS |
| IT & Services | $270B | $400B+ | AI-enabled |
| Renewable Energy | ~150 GW | 500 GW | Solar & Wind |
| Defence & Aerospace | Import-heavy | Self-reliant | Atmanirbhar |
| Construction & Infra | 18% of GDP | 100M+ jobs | Capex-led |
Key Risks & Challenges
| Risk | Nature | Status |
|---|---|---|
| Middle East energy disruption | Oil prices, rupee | ⚠️ Active Risk |
| Rupee depreciation | Import cost rise | ⚠️ Managed |
| US tariff uncertainty | Goods export impact | ✅ Deal Signed |
| China slowdown spillover | Supply chain ripple | ⚠️ Monitoring |
| Fiscal pressure (subsidies) | Oil subsidy balloon | ⚠️ Budget Risk |
| Low female workforce (18.6%) | Structural limit | ❌ Needs Action |
| Ease of doing business | Deters FDI | ⚠️ Reforms On |
| Informal sector undercount | Data quality | ✅ New GDP Live |
Conclusion
India in 2026 is a story of remarkable resilience in the face of extraordinary external pressure. Despite a Middle East conflict threatening energy security, US tariff headwinds, capital outflows, and a weakening rupee, India posted 7.6% GDP growth — the highest in the G20 by a wide margin.
The next 5–10 years hold transformational potential:
- 3rd largest economy by 2028
- GDP of $7.3 trillion by 2030
- Surpassing the US in PPP terms by 2038
The war-driven disruptions of 2025–26 have, counterintuitively, accelerated India’s pivot toward energy self-reliance, domestic manufacturing (Atmanirbhar Bharat), and diversified trade partnerships.
🇮🇳 Bottom Line: India is not merely resilient — it is transforming. The short-term turbulence from global conflicts is being absorbed by one of the world’s strongest domestic demand engines. For investors, policymakers, and businesses, India’s 5–10 year trajectory against the US, China, EU, and other major economies represents the most compelling large-economy growth story of our generation.
This content is for educational purposes only and does not constitute financial advice.
For more content, you can check here.
You can follow my social platforms here.
700+ YouTube content. You can subscribe to more live content here.
2200+ Twitter postings on live proof here.
Follow the Facebook page for updates.