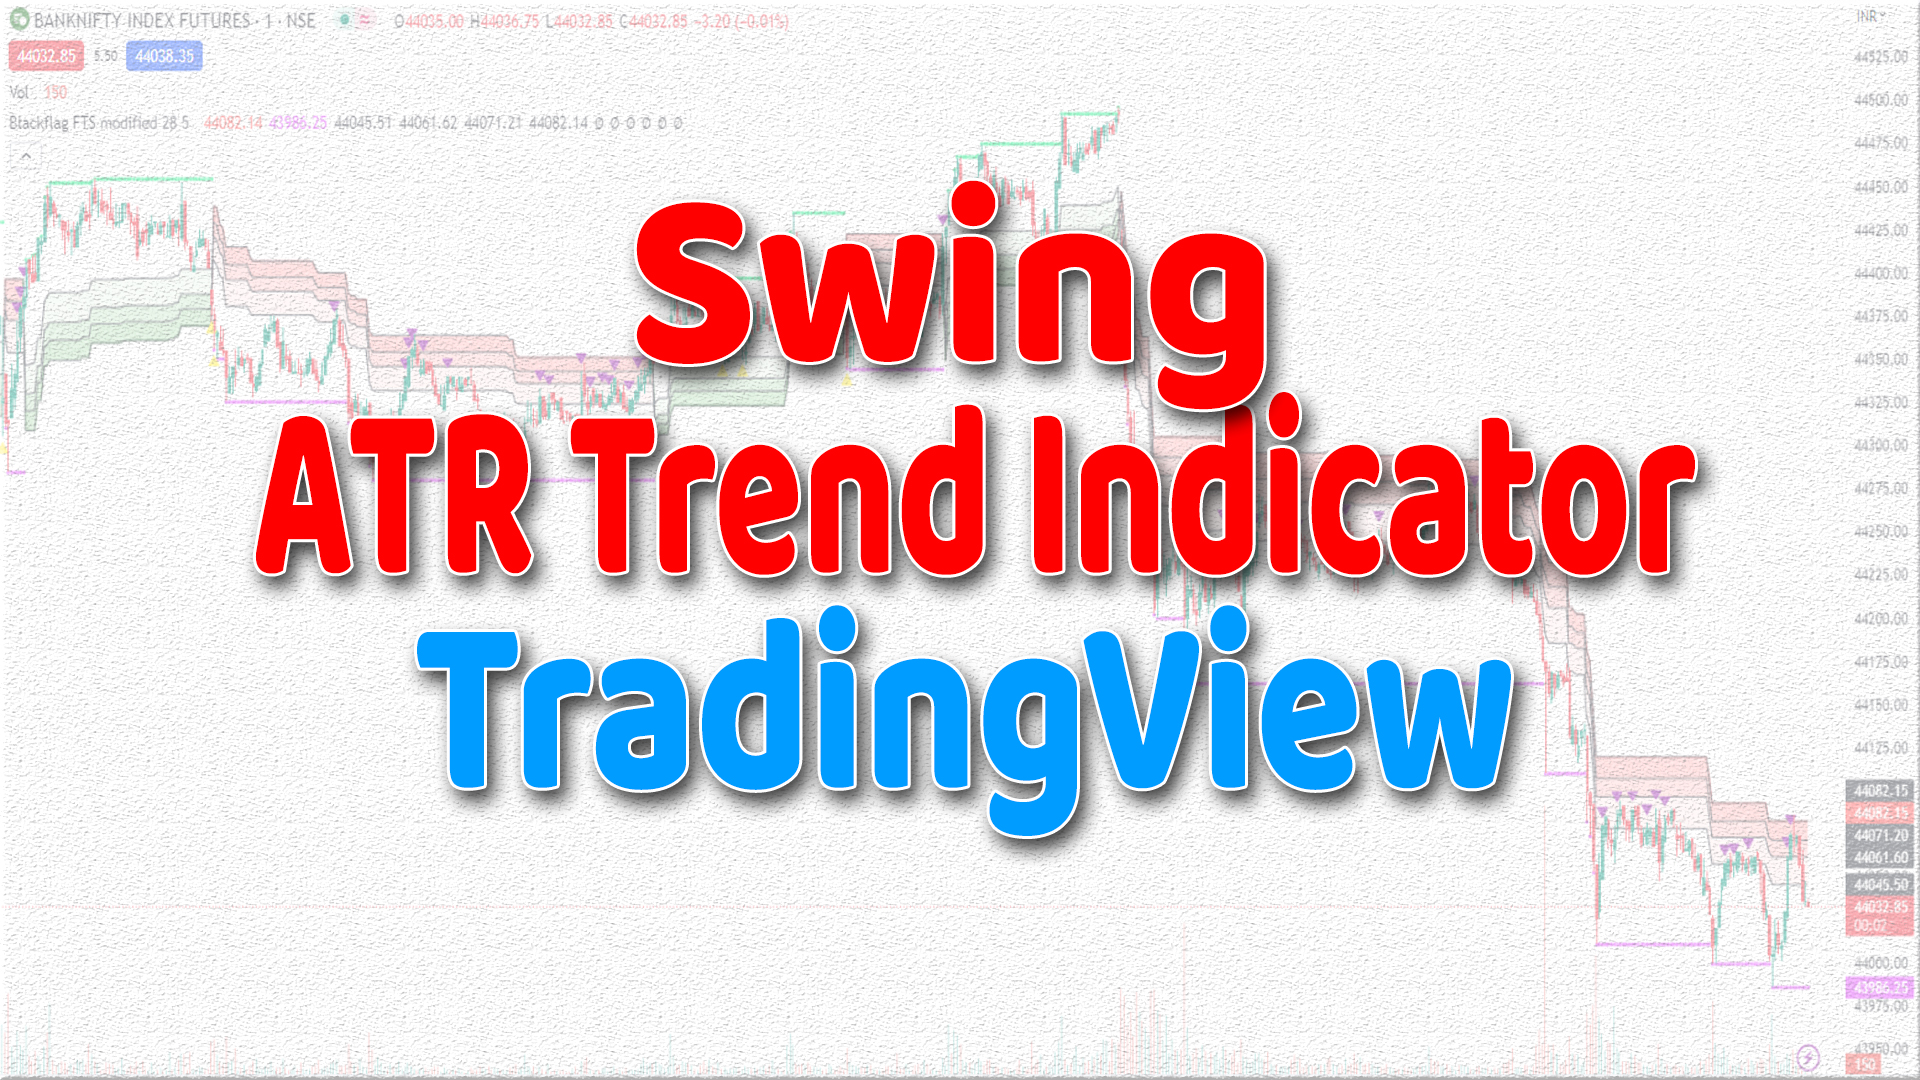
The “Swing ATR Trend Indicator” is a powerful tool used in technical analysis to identify and measure the strength of market trends. In 2023, the TradingView platform offers to access of swing ATR trend indicators, but one stands out as the best. This indicator utilizes the Average True Range (ATR) alongside swing analysis to provide you with accurate trend signals in the real-time market.
By combining the ATR, which measures market volatility, with swing analysis, which identifies key swing points in price action, this indicator effectively determines the direction and strength of a trend of the stock or market index. It helps you to spot trend reversals, entry and exit points, and potential profit targets including the stop loss.
The best swing ATR trend indicator on the TradingView platform in 2023 offers a user-friendly interface, customizable settings, and real-time market data. ATR Trend Indicator is one of the best indicators if you use it on positional trading.
Why do you use ATR Trend Indicator?
The ATR Trend Indicator is a valuable tool in trading for several reasons. Here ATR means Average True Range.
Firstly, this Indicator provides you with a reliable measure of market volatility, helping you to assess the potential range of price movement. This information is crucial for setting appropriate stop-loss and take-profit levels.
Secondly, the Trend Indicator identifies and confirms the strength of a trend. Incorporating swing analysis, helps you differentiate between genuine trend movements and temporary price fluctuations.
Furthermore, the Trend Indicator offers valuable insights into trend reversals. It can alert you to potential shifts in market sentiment, allowing them to adjust their trading strategies accordingly.
Overall, the Trend Indicator enhances decision-making by providing objective data on volatility, trend strength, and potential reversals. Traders who utilize this indicator have a better understanding of market dynamics, leading to more informed and potentially profitable trading decisions.
How to add Swing ATR Trend Indicator in TradingView Platform?
To add the Swing Trend Indicator to the TradingView platform, you can follow these steps:
Open the TradingView platform and navigate to the chart you want to apply the Swing Trend Indicator to.

Click on the “Indicators” button located at the top of the chart. It looks like a beaker icon.

In the search bar that appears, type “Swing ATR Trend” and select the “Swing ATR Trend” indicator (developer “vsnfnd”) from the suggestions. Click on it to add it to your chart.

How to Change Settings on Swing ATR Trend Indicator?
Once the ATR indicator is added, you need to modify its settings to make it display the Swing ATR Trend, if needed as per your requirement. To do this, click on the settings icon (gear icon) next to the added ATR indicator in the Indicator Settings panel.

The specific settings for the Swing ATR Trend Indicator may vary depending on the source or strategy you are using. You can adjust the color, line style, and other visual settings to your preference.
After setting the desired parameters, click the “OK” button to apply the changes and close the settings menu.
The Swing ATR Trend Indicator should now be displayed on your chart. You can further customize its appearance by right-clicking on the indicator line and selecting “Style” from the context menu.
Remember that the Swing ATR Trend Indicator is a customized version of the ATR indicator, and its specific implementation may vary depending on the source or strategy you are following. It’s always recommended to thoroughly understand the indicator and its parameters before using it in your trading decisions.
For other indicator experiences, you can go through my TradingView Indicator Section.
Basic rules of Swing ATR Trend Indicator?
You can simply follow the trend with color. Like, starting with the green color on Swing Trend Indicator you can buy for a target when you see the red crossover color seen on the Trend line indicator. Simply following the color trend you can earn a certain amount of money from the market.
For a more concrete view, you need to add more indicators.
You can see a cloud range of this indicator and two middle lines parallel to this cloud. All line reacts as Support and Resistance.
Best Timeframe to Use
For those who are interested to trade with scalping then this is for you. It’s very good for lower time frame trade or best for paper trading. 1 minute, 3 minutes, 5 minutes, 10 minutes, or 15 minutes is best for this indicator. This is the best intraday trading indicator.
For more content, you can check here.
You can follow my social platforms here.
500+ Youtube content. You can subscribe for more live content here.
2200+ Twitter Posting on live proof here.
Follow the Facebook page for updates.


