A swing indicator is a tool used in trading to identify short-term trends. Specifically, a volume-based swing indicator analyzes price and volume data to spot swings or changes in the market. It helps traders understand when there is increased buying or selling pressure, which can indicate potential turning points or continuation of trends. By plotting these swings on a chart, the indicator provides visual cues to make informed trading decisions. Overall, a volume-based swing indicator is a useful tool for traders to spot opportunities based on price and volume data.
Tradingview free platform for Tradingviewchart
TradingView offers a free platform called TradingView Chart that provides a wide range of tools and features for traders. With TradingView Chart, users can access real-time market data and charts from various financial markets, including stocks, cryptocurrencies, forex, and more.
The platform offers an intuitive and user-friendly interface, making it easy for traders to navigate and analyze market data. Traders can customize their charts by selecting different timeframes, chart types, and technical indicators to suit their trading strategies.
TradingView Chart also provides a variety of drawing tools, such as trendlines, Fibonacci retracements, and support/resistance levels, allowing traders to perform technical analysis and identify potential trade setups.
Overall, TradingView’s free platform, TradingView Chart, is a powerful tool for traders, offering real-time market data, customizable charts, technical analysis tools, and a social community for sharing ideas and insights.
To access the Tradingview you can click here.
For more about Tradingview you can go to this link.
Simple Volume Indicator
On the TradingView platform, a simple volume indicator is typically displayed as a histogram or a line graph beneath the price chart. It represents the volume of shares or contracts traded during a specific period, such as a day, week, or month or any real-time frame like a 1-minute chart, 5-minute chart, 15-minute chart, 30-minute chart, or more.
The volume indicator on TradingView shows bars or lines that correspond to the volume traded at each price level. The height or length of the bars/lines represents the volume traded during that specific period. Higher bars or longer lines indicate higher trading volume, while lower bars or shorter lines represent lower volume.
The color of the volume bars/lines may vary depending on the platform’s settings. Typically, green or white bars/lines indicate that the price closed higher than the previous period, while red or black bars/lines indicate a lower closing price. This color coding helps traders quickly assess the volume and price movement relationship.

The volume indicator is valuable for traders as it provides insights into the strength and conviction behind price movements. High volume often accompanies significant price changes, suggesting increased market participation and potentially signaling the start of a new trend or the continuation of an existing one. Conversely, low volume can indicate a lack of interest or participation, potentially signaling a period of consolidation or indecision in the market.
Overall, the volume indicator on the TradingView platform helps traders visualize and interpret trading volume, allowing them to assess market sentiment and make more informed trading decisions based on the relationship between volume and price.
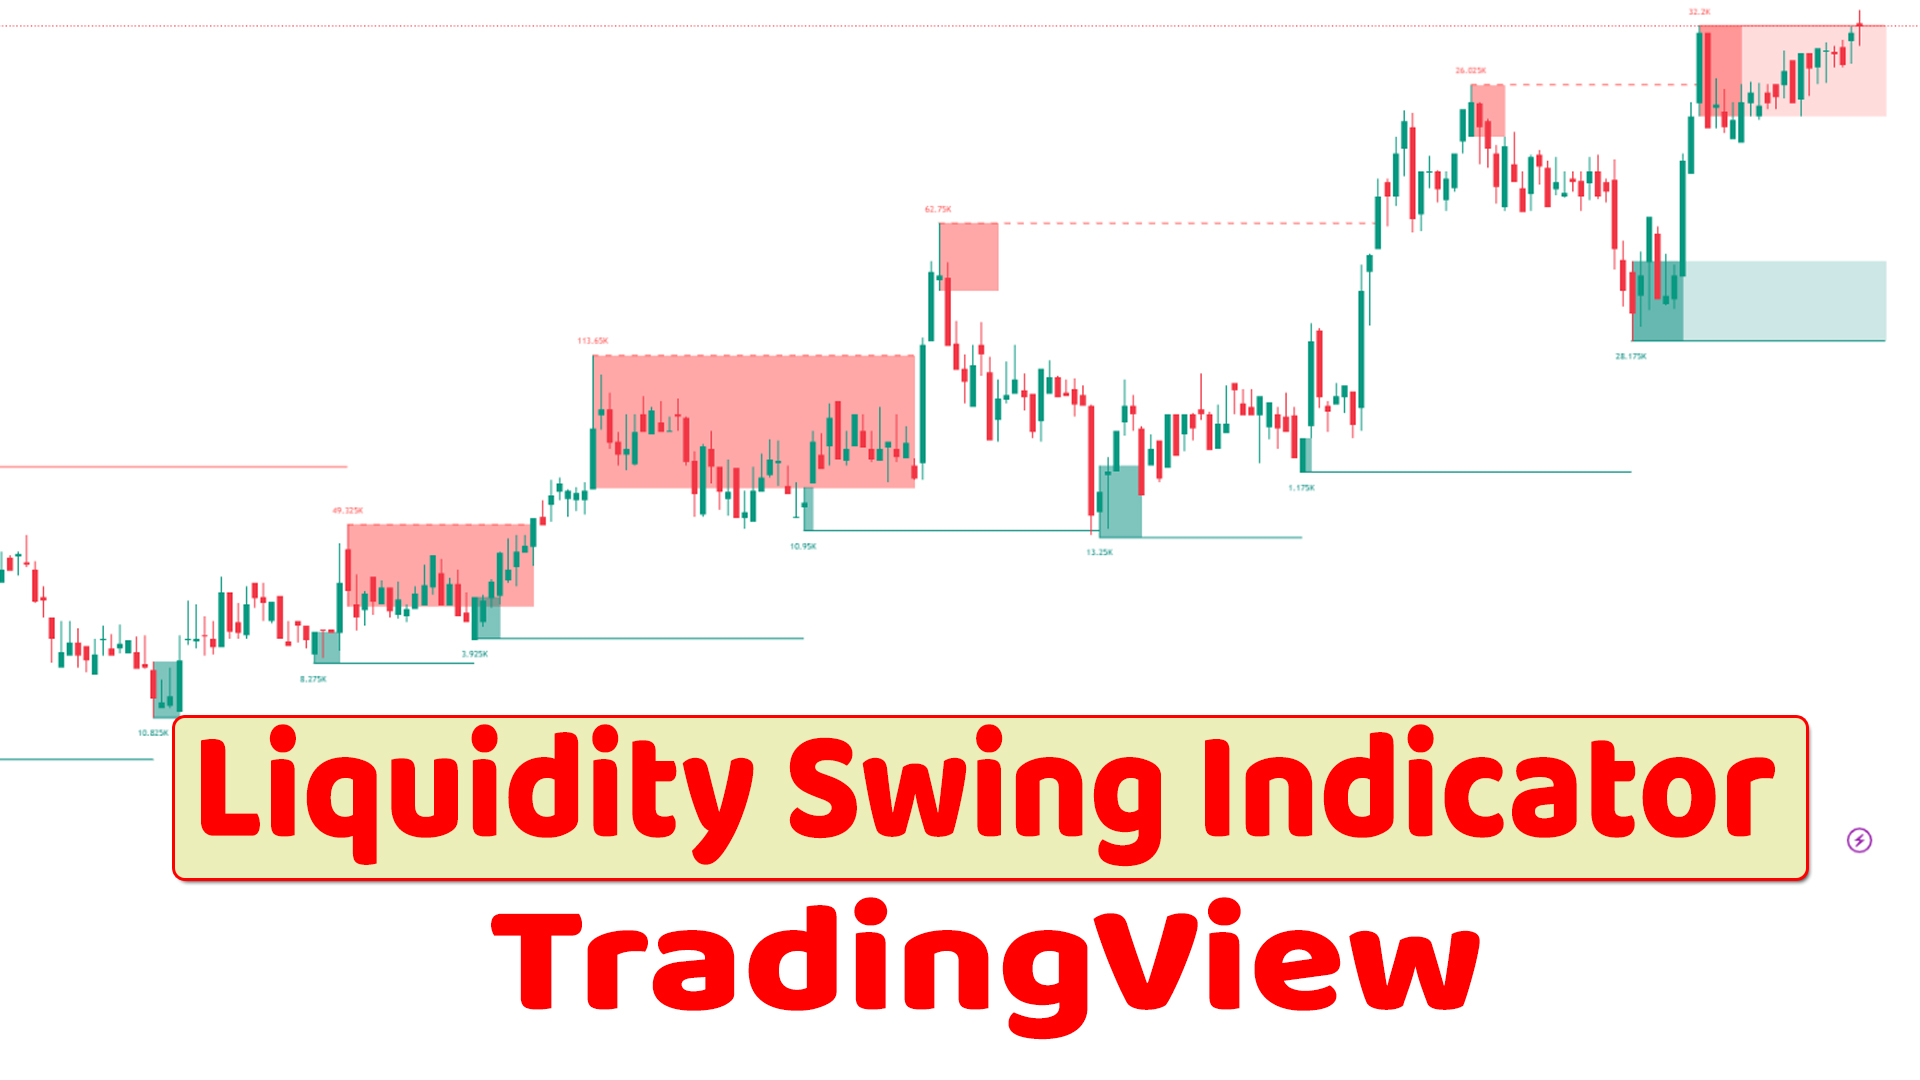
Liquidity Swing Indicator
A swing indicator is a tool used in trading to identify short-term trends, and a volume-based liquidity swing indicator takes into account both volume and liquidity data to analyze market dynamics. By assessing the combination of volume and liquidity, this indicator helps traders spot potential turning points and continuation of trends. It provides valuable insights into market participation and the availability of assets for trading, aiding in making informed trading decisions. Overall, a volume-based liquidity swing indicator is a useful tool for traders to identify short-term trends based on volume and liquidity data.
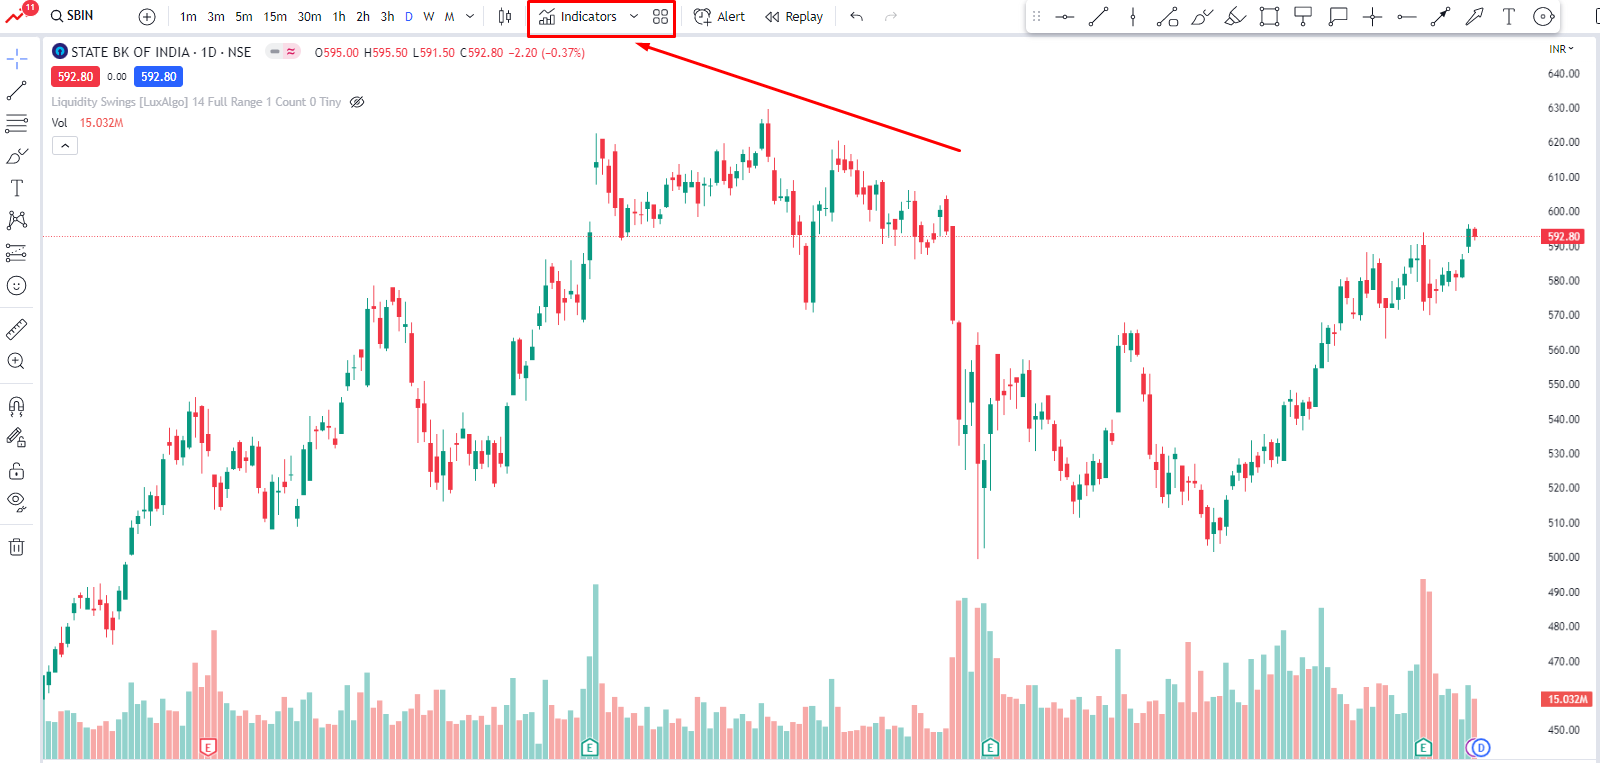
How to add “Liquidity Swing Indicator” on TradingView
Login to the Tradingview site with your user ID and password for free access. On top of the tradingviewchart, you can see the “Indicator” section. Click the “Indicator”. A pop-up window will be open.
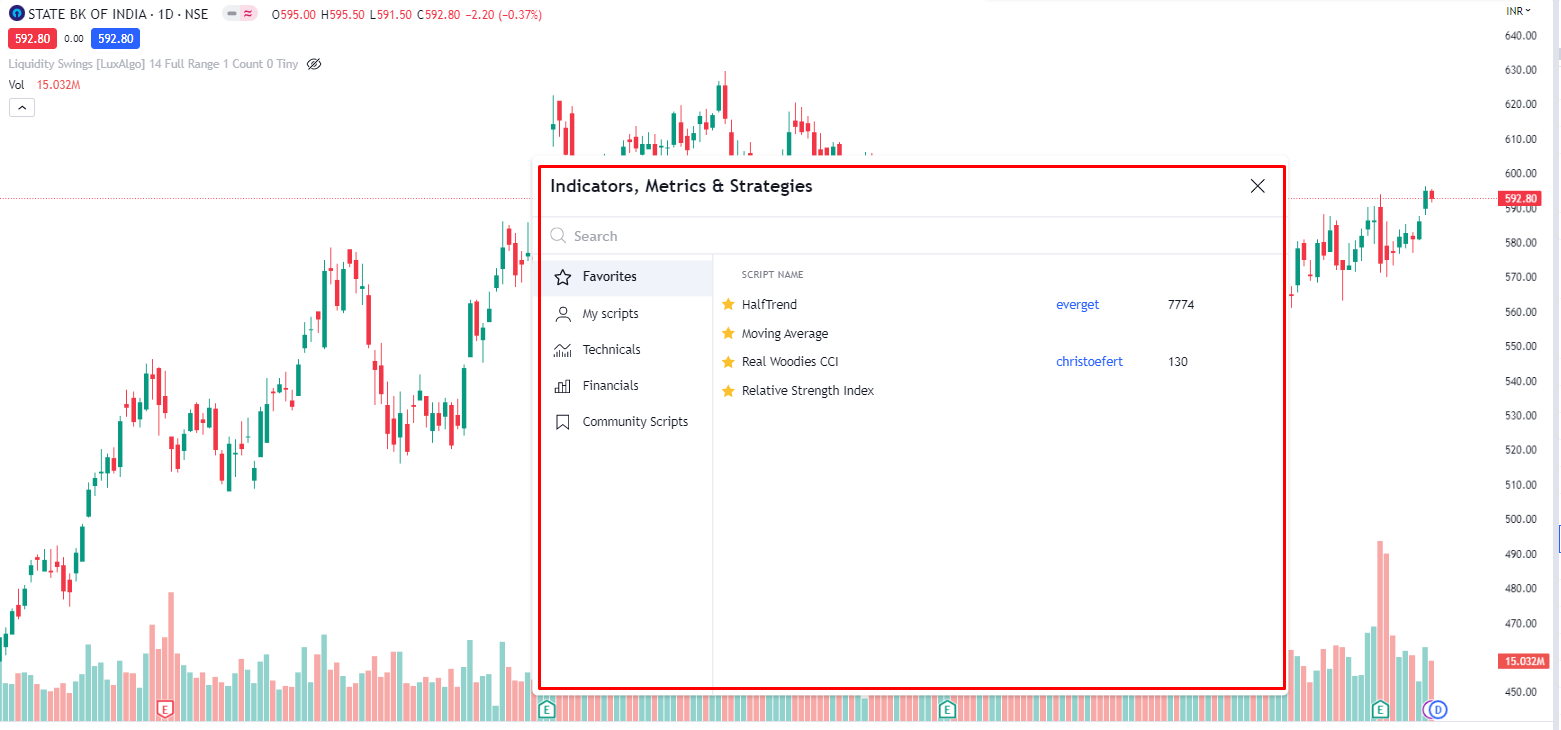
Here just type “Liquidity Swing” and you will see a lot of indicator lists.

Select the developer name shown as “LuxAlgo” and insert it on your existing chart by clicking on it.
After inserting the indicator you will see the chart with some visual changes.

You can change any settings by clicking the setting icon as per your requirement.

How “Liquidity Swing Indicator” works on TradingView Platform
This is a volume-based trading indicator that mostly analyzes the volume performance against the price trend. How much volume happens on the chart and for which range, it will give you a glance report. If you looking for swing trading then it will help you to figure out the trend as per volume analyst. You can use this indicator along with your favorite indicator to compare the analyst against your stock.
You can go through the tutorial video for more information here.