Master the Relative Strength Index for Professional Trading Success. Learning Advanced RSI is a great opportunity for a new trader.
Understanding RSI Beyond the Basics
The Relative Strength Index (RSI) is one of the most popular momentum oscillators in technical analysis, but most traders only scratch the surface of its potential. While beginners use RSI to identify simple overbought and oversold conditions, advanced traders unlock its full power through sophisticated techniques that go far beyond the traditional 30/70 thresholds.
Developed by J. Welles Wilder Jr. in 1978, the RSI measures the magnitude of recent price changes to evaluate overbought or oversold conditions in asset prices. The indicator oscillates between 0 and 100, with readings above 70 traditionally considered overbought and below 30 considered oversold. However, advanced applications of RSI can help identify trend strength, divergences, failure swings, and precise entry and exit points that give professional traders a significant edge in the markets.
Advanced RSI Strategies
1. RSI Divergence Trading
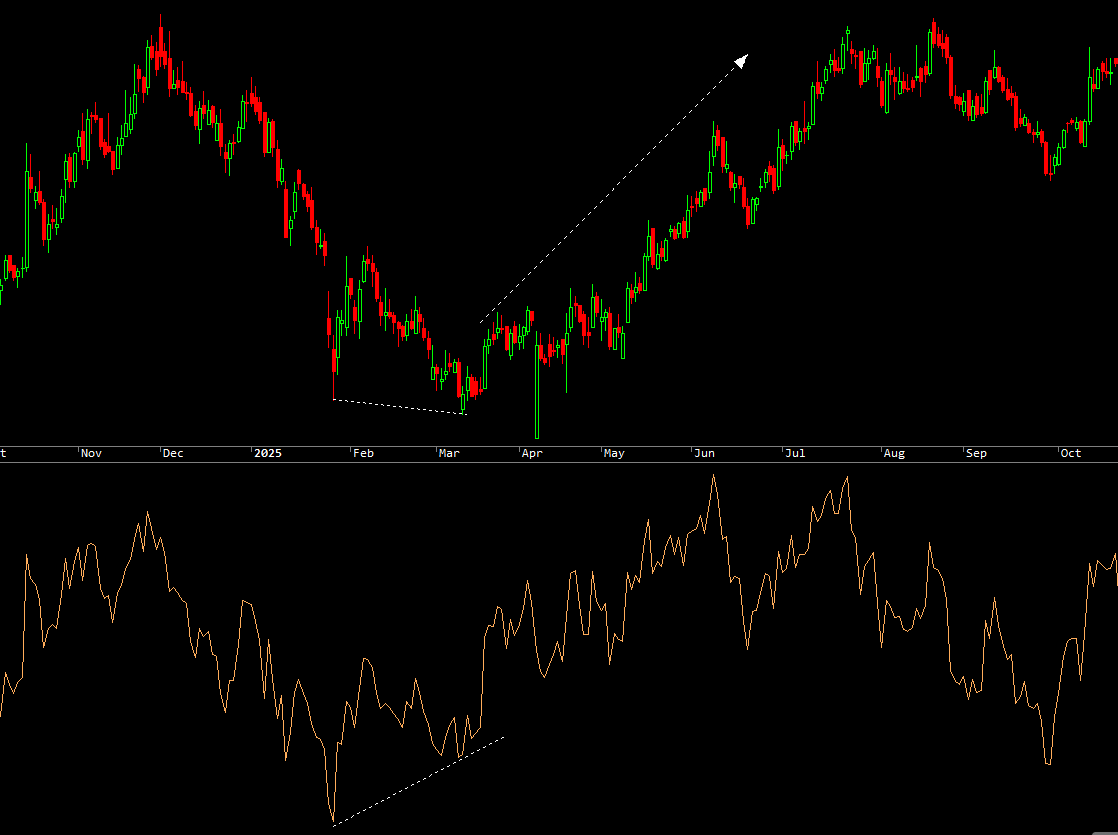
Divergence occurs when price action and RSI readings move in opposite directions, signalling potential trend reversals. This is one of the most powerful advanced RSI techniques that can alert traders to weakening momentum before it becomes obvious in price action.
Bullish Divergence happens when the price makes lower lows while RSI makes higher lows. This indicates that downward momentum is weakening, and a potential upward reversal may be imminent. Bullish divergence is particularly powerful when it occurs near major support levels or in oversold territory.
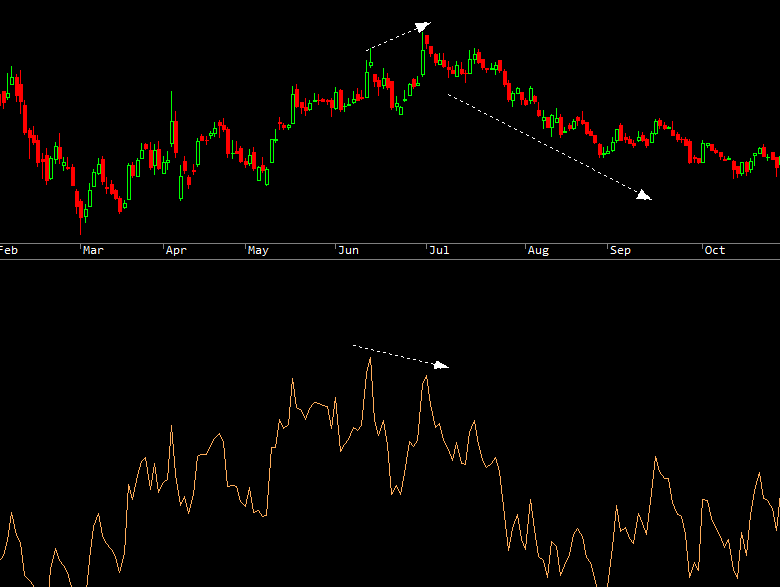
Bearish Divergence occurs when the price makes higher highs while RSI makes lower highs. This suggests that upward momentum is weakening and a possible downward reversal could be approaching. Bearish divergence is most reliable when it forms near resistance levels or in overbought conditions.
The key to successful divergence trading is patience. Wait for price action confirmation, such as a candlestick reversal pattern or a break of a trend line, before entering the trade. Hidden divergences can also signal trend continuation rather than reversal, providing additional trading opportunities.
2. RSI Failure Swings
Failure swings are independent chart patterns that form on the RSI itself, often signaling trend reversals before they appear on the price chart. This advanced technique doesn’t require price confirmation, making it a leading rather than lagging indicator.
Bullish Failure Swing occurs in four steps: RSI drops below 30 into oversold territory, bounces back above 30, pulls back but holds above 30 (creating a higher low), then breaks above its previous high. This pattern demonstrates that sellers are losing control and buyers are stepping in with increasing strength.
Bearish Failure Swing also occurs in four steps: RSI rises above 70 into overbought territory, falls below 70, rallies but stays below 70 (creating a lower high), then breaks below its previous low. This pattern shows that buyers are exhausting and sellers are gaining control.
Failure swings are particularly reliable when they form after extended trends and can provide early warning signals for major reversals.
3. Dynamic RSI Levels
Instead of using fixed 30/70 levels in all market conditions, advanced traders adjust RSI thresholds based on the prevailing trend and volatility environment. This adaptation prevents premature exits and reduces false signals that plague traditional RSI interpretation.
In strong uptrends, consider using 40/80 levels rather than 30/70. The market may not pull back to 30 during healthy uptrends, so waiting for traditional oversold readings means missing quality trade entries. Similarly, overbought readings above 70 can persist throughout strong upward momentum.
In strong downtrends, use 20/60 levels to adapt to the bearish environment. Down trending markets often remain oversold for extended periods, making 30 an unreliable buy signal. The 60 level can serve as resistance in downtrends, where rallies are selling opportunities rather than signs of reversal.
For ranging or choppy markets, the traditional 30/70 levels work best as the market oscillates between these boundaries without establishing a clear trend.
4. Multi-Timeframe RSI Analysis
Combining RSI readings from multiple timeframes creates a powerful confluence that significantly improves signal reliability and filters out noise. This technique helps traders align their positions with both short-term opportunities and longer-term trends.
The approach involves analyzing RSI on at least three different timeframes. For example, a day trader might examine 5-minute, 15-minute, and 1-hour charts. A swing trader might use daily, weekly, and monthly timeframes. The principle remains the same: seek alignment or understand the conflict between timeframes.
When RSI shows oversold conditions on your trading timeframe while the higher timeframe RSI remains neutral or bullish, this confluence provides stronger conviction for a long position. The trade aligns with the larger trend while capitalizing on a short-term pullback.
Conversely, if your trading timeframe shows a buy signal but the higher timeframe RSI is deeply overbought or showing bearish divergence, this conflict suggests caution or avoiding the trade altogether.
5. RSI Trendline Breaks
Just as traders draw trendlines on price charts, advanced practitioners draw trendlines directly on the RSI indicator itself. These RSI trendlines often break before price trendlines, providing an early warning system for potential trend changes.
To apply this technique, connect the highs or lows on the RSI indicator just as you would on a price chart. In uptrends, draw trendlines connecting the higher lows on RSI. In downtrends, connect the lower highs. When these RSI trendlines break, it signals weakening momentum that often precedes a price trend reversal.
RSI trendline breaks are particularly powerful when they coincide with divergence patterns or failure swings, creating multiple layers of confirmation for the potential trade.
RSI Period Optimization
While the standard 14-period RSI is widely used and works well for most applications, advanced traders optimise the period setting based on their specific trading style, timeframe, and the characteristics of the asset being traded.
Short-term trading with 5-9 periods creates a more sensitive indicator that responds quickly to price changes. This generates more trading signals and can be beneficial for scalpers and day traders who need rapid feedback. However, the increased sensitivity also produces more false signals and whipsaws, requiring additional confirmation methods.
Medium-term trading with the standard 14 periods provides a balanced approach suitable for swing trading and position trading. This setting has stood the test of time and works well across various markets and timeframes. It’s sensitive enough to catch significant moves while filtering out much of the short-term noise.
Long-term trading with 21-25 periods produces a smoother indicator with fewer signals but higher reliability. This setting is preferred by position traders and investors who want to identify major trend changes without getting shaken out by normal market fluctuations.
Advanced traders often monitor multiple RSI periods simultaneously, using shorter periods for timing entries and longer periods for confirming the overall trend direction. Back testing different RSI periods on your specific market and timeframe is essential for finding the optimal setting that maximises your personal win rate and risk-adjusted returns.
Combining RSI with Other Indicators
While RSI is powerful on its own, advanced traders amplify its effectiveness by combining it with complementary technical indicators. This multi-indicator approach provides confirmation and reduces false signals.
RSI + Moving Averages
Moving averages help establish the primary trend direction while RSI identifies optimal entry timing within that trend. The strategy involves using moving averages (such as 50-day and 200-day) to determine if the market is in an uptrend or downtrend, then only taking RSI signals that align with that trend.
In an uptrend (price above moving averages), focus on RSI oversold readings as buying opportunities. Ignore overbought readings as the market can remain overbought during strong uptrends. In a downtrend (price below moving averages), focus on RSI overbought readings as selling opportunities while avoiding oversold buy signals.
This combination prevents the common mistake of fighting the trend based solely on RSI extremes.
RSI + MACD
The Moving Average Convergence Divergence (MACD) indicator complements RSI by confirming momentum shifts from a different analytical perspective. When both indicators show bullish or bearish divergence simultaneously, the signal strength increases dramatically.
Look for situations where RSI shows bullish divergence while MACD histogram forms higher lows or shows a bullish crossover. This dual confirmation suggests that momentum is shifting from bearish to bullish across multiple measurement methods. The same principle applies to bearish setups with both indicators showing weakness.
RSI + Volume Analysis
Volume provides crucial context for RSI signals by showing the strength of participation behind price moves. High volume accompanying RSI extremes adds significant confirmation to potential reversal points, indicating that the move has substantial trader interest and is more likely to follow through.
Conversely, low volume during RSI extremes suggests weak conviction and increases the probability that the signal will fail. For example, an RSI oversold reading with declining volume may indicate that the downtrend lacks selling pressure and could reverse, but the low volume also suggests that buyers aren’t yet stepping in forcefully.
Volume spikes during RSI divergences are particularly powerful, as they show institutional participation in the emerging trend change.
Advanced Risk Management with RSI
Professional traders leverage RSI not just for identifying entry points, but for sophisticated position and risk management throughout the entire trade lifecycle.
Scaling positions involves adding to winning trades as RSI confirms momentum continuation. For example, after entering a long position on an RSI oversold signal, add to the position when RSI crosses back above 50, confirming that buyers have taken control. This allows you to build larger positions in high-probability trades while keeping initial risk manageable.
Trailing stops can be adjusted based on RSI readings crossing key thresholds. As a long position becomes profitable and RSI reaches overbought territory, tighten stops to protect gains. If RSI crosses back below 50, consider moving stops to breakeven or taking partial profits.
Profit targets should incorporate RSI extremes. When your position moves in your favor and RSI reaches extreme overbought or oversold levels, consider taking partial profits. This locks in gains before potential reversals while allowing a portion of the position to run if momentum continues.
Position sizing should be adjusted based on RSI signal quality. When RSI shows strong confluence across multiple timeframes with clear divergence or failure swing patterns, you can justify larger position sizes. When signals are ambiguous or conflicting, reduce position size accordingly.
Never risk more than you can afford to lose, and always use stop-losses regardless of how confident an RSI signal appears.
Common RSI Mistakes to Avoid
Even experienced traders fall into these common traps when using RSI. Awareness of these mistakes can significantly improve your trading results.
Trading against the trend is perhaps the most common and costly mistake. Many traders automatically short when RSI reaches 70 or buy when it drops to 30, without considering the broader trend context. In strong trends, RSI can remain in extreme territory for extended periods while price continues moving in the trend direction. Always consider the larger timeframe trend before taking counter-trend RSI signals.
Ignoring divergence confirmation leads to premature entries. Divergences can continue developing for several bars or even weeks before the price actually reverses. Wait for price action confirmation, such as trendline breaks, support/resistance bounces, or candlestick reversal patterns, before entering trades based on divergence alone.
Using fixed levels in all markets assumes that all assets and market conditions behave identically. Different markets have different characteristics. Cryptocurrency markets might see RSI readings behave differently from stock markets. Volatile stocks may spend more time in extreme RSI territory than stable blue-chips. Adapt your RSI thresholds to the specific asset and current market regime.
Overtrading signals occur when traders take every RSI crossing as a valid trade opportunity. Not every move above 70 or below 30 represents a high-probability trade. Require additional confirmation from price action, volume, or other indicators before committing capital.
Neglecting market context means ignoring fundamental factors, news events, and overall market sentiment. RSI is a technical tool that measures past price action. It doesn’t account for unexpected news, earnings reports, or macro events that can override technical signals. Always consider the broader market context and risk environment before trading RSI signals.
Conclusion
Advanced RSI trading extends far beyond simple overbought and oversold interpretations. By mastering divergence patterns, failure swings, dynamic threshold adjustments, multi-timeframe analysis, and proper indicator combinations, traders can transform RSI from a basic oscillator into a sophisticated trading system.
The key to success lies in understanding that RSI is a tool for identifying momentum shifts and potential reversal points, not a crystal ball that predicts future prices with certainty. Always combine RSI analysis with proper risk management, position sizing, and confirmation from price action or other indicators.
Practice these advanced techniques on historical data, start with small position sizes, and gradually refine your approach based on what works best for your trading style and the markets you trade. With dedication and proper application, advanced RSI strategies can provide a significant edge in your trading arsenal.
For more content, you can check here.
You can follow my social platforms here.
500+ YouTube content. You can subscribe for more live content here.
2200+ Twitter Posting on live proof here.
Follow the Facebook page for updates.