The Head and Shoulders Pattern is one of the most recognizable and reliable patterns in technical analysis. It’s a powerful tool traders use to predict trend reversals, helping them make informed decisions in both bullish and bearish markets. Whether you are new to trading or an experienced market participant, mastering this pattern can significantly improve your success rate.
In this article, we will explore the head and shoulders pattern in detail, explain its significance, and show you how to use it effectively in your trading strategy.
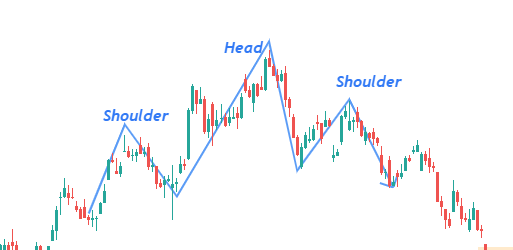
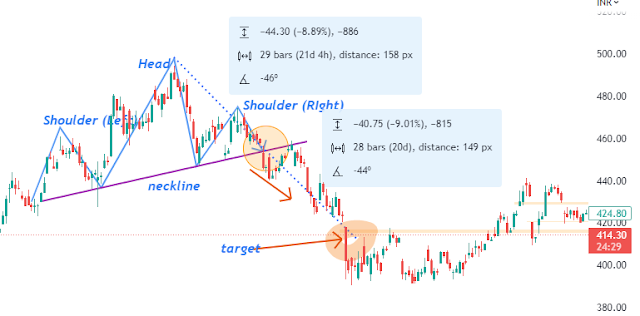
This pattern is made up of four main parts: the left shoulder, the head, the right shoulder, and the neckline. The pattern is named for its resemblance to a person’s head and shoulders.
What is the Head and Shoulders Pattern?
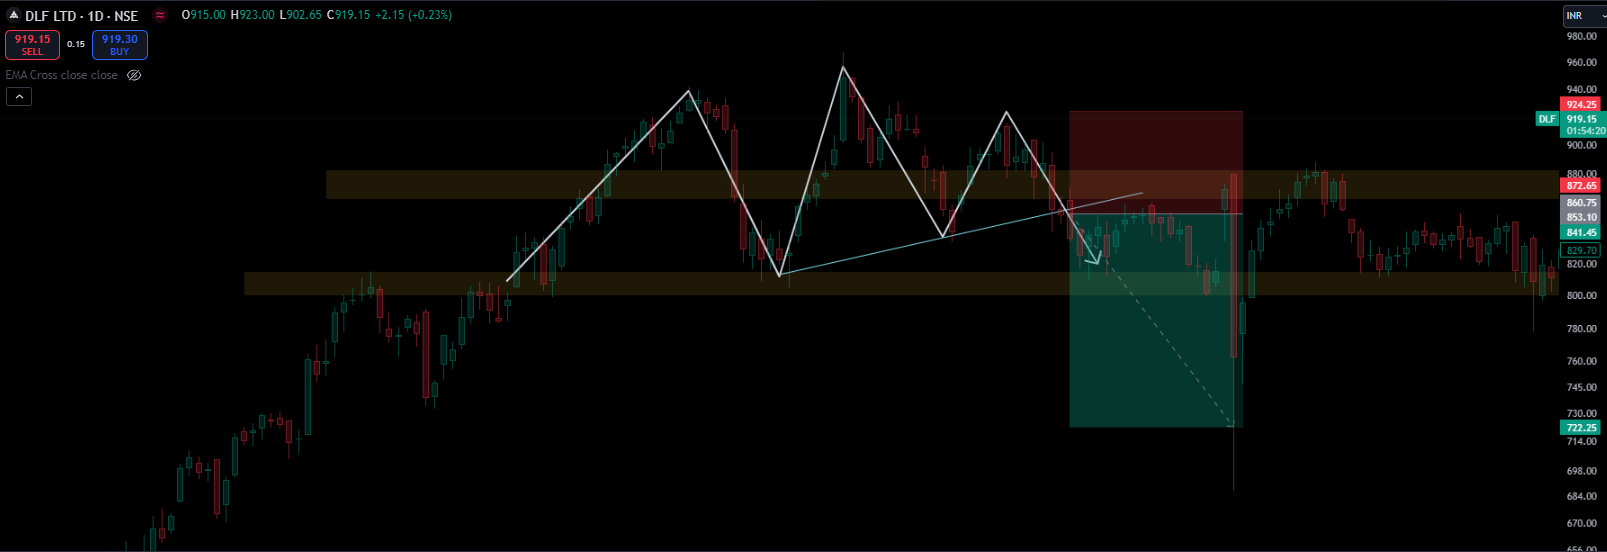
The Head and Shoulders Pattern is a chart formation that signals a trend reversal from bullish to bearish. It consists of three peaks: two outer peaks (shoulders) and a higher middle peak (head). The pattern is most commonly found in an uptrend, indicating that the market is about to reverse and start a downtrend.
The head and shoulders pattern is a popular technical analysis pattern that is used to identify potential reversals in the direction of an asset’s price. It is called the head and shoulders pattern because it looks like a head with two shoulders on either side. The pattern is formed when the price of an asset reaches a peak and then falls, only to rise again to a slightly lower peak before falling again. This creates the “head” and the two “shoulders” on either side. The pattern is considered a bearish signal, indicating that the asset’s price is likely to continue falling.
Types of Head and Shoulders: Regular vs. Inverse
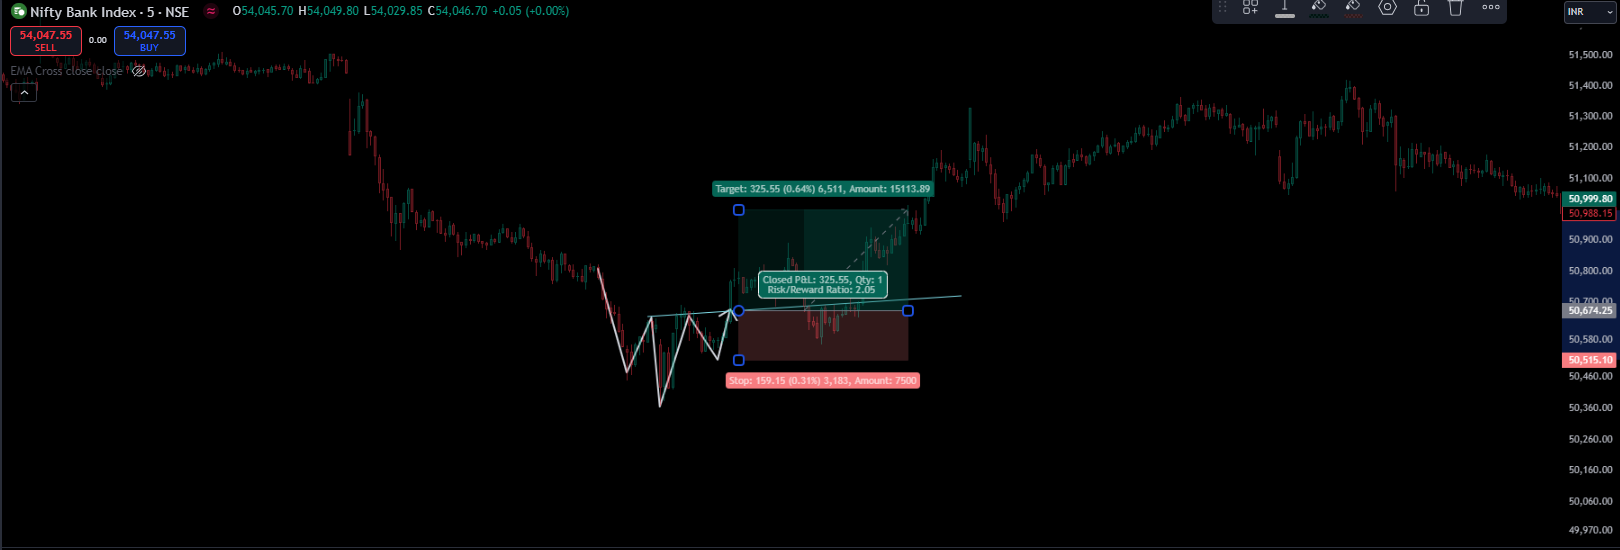
While the standard head and shoulders pattern signals a bearish reversal, its counterpart, the Inverse Head and Shoulders, signals a bullish reversal. This occurs in a downtrend when the market is about to shift into an uptrend.
To use the head and shoulders pattern in trading, follow these steps:
Identify the pattern on a chart by looking for a series of peaks and troughs that form a distinct head and two shoulders.
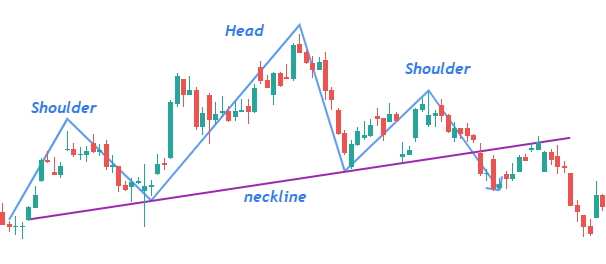
Identify the neckline, a line drawn across the lows of the pattern.
Wait for the price to break below the neckline, which is a signal that the trend is reversing, and the price is likely to fall.
Enter a short position at the break of the neckline, with a stop loss above the right shoulder of the pattern.
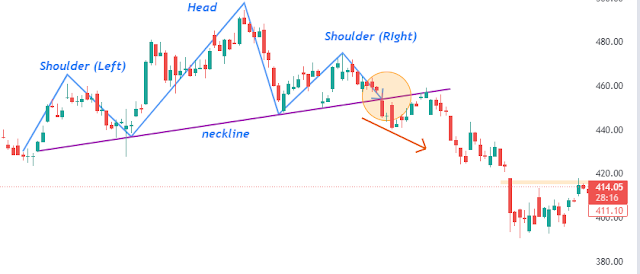
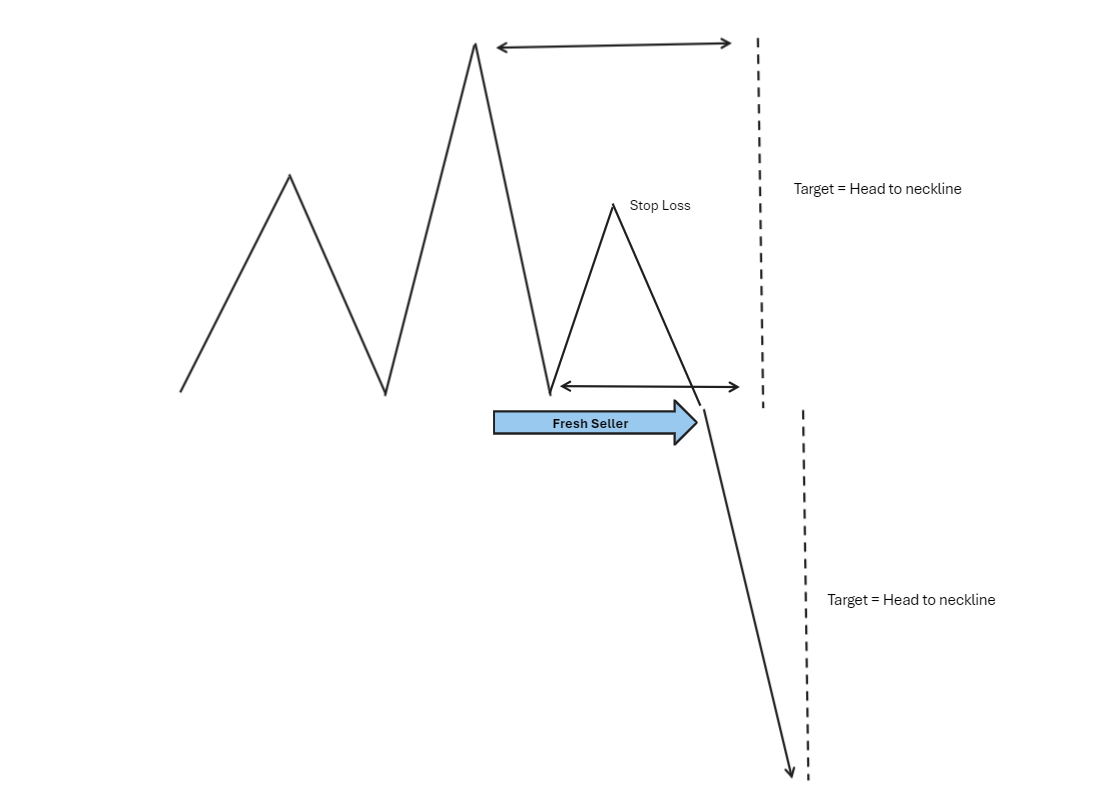
Set a target price by measuring the distance between the neckline and the head of the pattern and projecting that distance downward from the neckline.
Monitor the trade and adjust the stop loss and target as needed based on market conditions and your risk management strategy.
Close the trade when the target price is reached or when the market signals that the trend has reversed again.
Anatomy of the Head and Shoulders Pattern
The Left Shoulder
The left shoulder forms when the price rises to a peak and then declines to form a trough.
The Head
The head is created when the price rises again, higher than the left shoulder, forming a new peak before declining once more.
The Right Shoulder
The right shoulder forms when the price rises a third time but fails to reach the height of the head, creating a lower peak.
The Neckline
The neckline is the key support or resistance level connecting the two troughs of the pattern. A break below the neckline confirms the completion of the pattern and signals a reversal.
Psychology Behind the Head and Shoulders Pattern
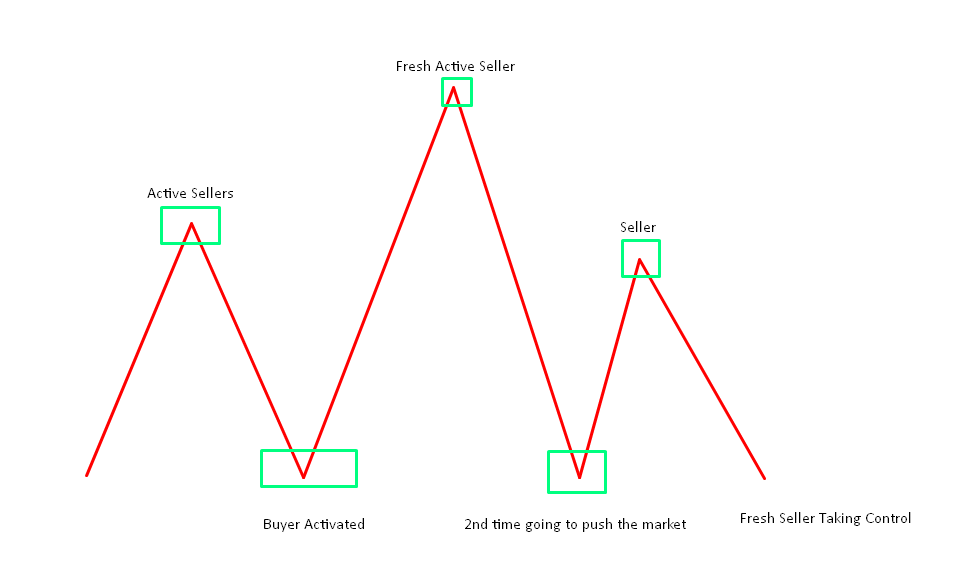
The psychology behind the pattern reflects the shifting dynamics between buyers and sellers. The left shoulder indicates strong buying, but as the head forms, it shows a peak in buying strength. By the time the right shoulder forms, buyers are losing control, and sellers begin to dominate. A break below the neckline confirms that the market sentiment has shifted from bullish to bearish.
Bullish to Bearish Reversal
In the case of the regular head and shoulders pattern, the market shifts from bullish to bearish, meaning it’s time for traders to consider short positions.
The Inverse Head and Shoulders Pattern
How It Differs from the Regular Pattern
The Inverse Head and Shoulders is a mirror image of the regular pattern. It forms after a downtrend and signals a reversal to the upside. This pattern suggests that sellers are losing momentum, and buyers are gaining strength.
Bullish Reversal Implications
The break above the neckline in an inverse head and shoulders pattern signals a bullish reversal, providing a great opportunity for long trades.
How to Identify a Head and Shoulders Pattern
Visual Identification on Charts
The head and shoulders pattern is easy to spot visually on price charts. It consists of three distinct peaks, with the second peak (the head) being the highest.
Key Factors to Look For
- Symmetry between the shoulders
- Clear peaks and troughs
- A defined neckline
How to Trade the Head and Shoulders Pattern
Entry Points
The ideal entry point is when the price breaks the neckline. A confirmed break signals the start of the reversal.
Stop-Loss Strategies
Place a stop-loss above the right shoulder in the case of a regular pattern, or below the right shoulder for an inverse pattern.
Take-Profit Zones
Many traders set their take-profit target at a distance equal to the height of the head, measured from the neckline.
Timeframes and Their Importance
Short-term vs. Long-term Patterns
Head and shoulders patterns can appear in both short-term and long-term charts. Longer-term patterns tend to provide more reliable signals.
Which Timeframe is Most Reliable?
The daily or weekly timeframe is generally the most reliable for identifying the head and shoulders pattern, as it filters out noise from smaller timeframes.
Common Mistakes When Trading the Head and Shoulders Pattern
Misinterpreting the Pattern
One common mistake is seeing a head and shoulders where none exists. It’s important to ensure the pattern is well-formed before trading.
Ignoring Other Technical Indicators
Don’t rely solely on the head and shoulders pattern. Combining it with other indicators can strengthen your trading strategy.
Using Volume to Confirm the Head and Shoulders Pattern
Why Volume Matters
Volume plays a crucial role in confirming the pattern. During the formation of the head, you’ll typically see increased volume, followed by a drop as the right shoulder forms.
How to Use Volume as a Confirmation Signal
A spike in volume when the price breaks the neckline is a strong confirmation that the reversal is legitimate.
Combining Head and Shoulders with Other Technical Indicators
RSI, MACD, and Moving Averages
You can combine the head and shoulders pattern with indicators like the Relative Strength Index (RSI), Moving Average Convergence Divergence (MACD), and moving averages to improve the accuracy of your trades.
Creating a Stronger Trading Strategy
Using multiple indicators in conjunction with the head and shoulders pattern can help you confirm trade setups and avoid false signals.
Risk Management When Trading the Head and Shoulders Pattern
Setting Proper Stop-Losses
Always set a stop-loss to limit your risk in case the market moves against your position.
Managing Trade Size
Proper risk management involves keeping your trade size appropriate for your account balance and overall risk tolerance.
Real-Life Examples of Head and Shoulders Patterns
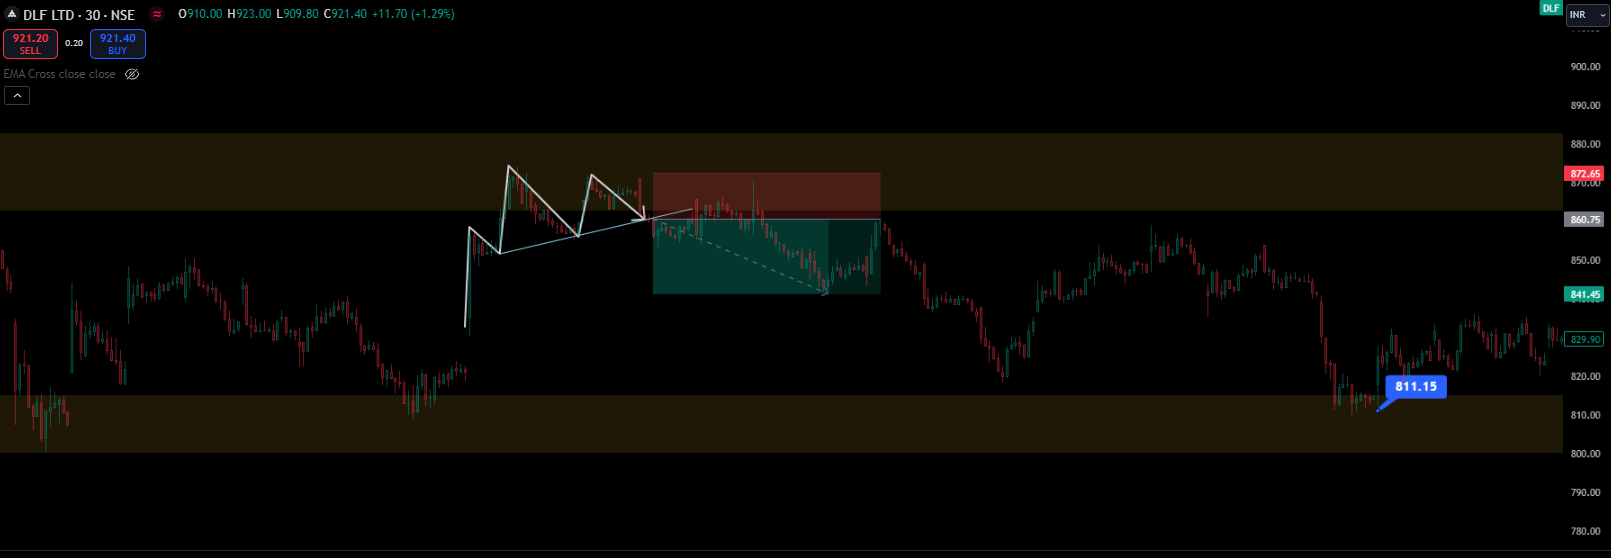
Historical Case Studies
Many notable head and shoulders patterns have appeared in historical stock charts, including during major market crashes and recoveries.
Charts and Patterns Explained
By studying these real-life examples, you can better understand how the pattern behaves in different market conditions.
Advantages and Disadvantages of Trading the Head and Shoulders Pattern
Pros
- Clear entry and exit points
- Reliable reversal signal
- Easy to spot on charts
Cons
- Not foolproof
- Can produce false signals in choppy markets
Conclusion
The Head and Shoulders Pattern is a powerful technical analysis tool that traders use to identify potential trend reversals. Understanding its anatomy, and psychology, and how to trade it effectively can greatly enhance your trading strategy. However, always combine it with other indicators and maintain sound risk management to improve your chances of success.
FAQs
- What is the best timeframe to use the head and shoulders pattern?
- The daily or weekly timeframes tend to offer the most reliable signals.
- Can the head and shoulders pattern appear in any market?
- Yes, this pattern can form in any liquid market, including stocks, forex, and commodities.
- How do I confirm a head and shoulders pattern?
- Use volume, neckline breaks, and additional technical indicators like RSI or MACD for confirmation.
- What is the difference between regular and inverse head and shoulders?
- The regular pattern signals a bearish reversal, while the inverse indicates a bullish reversal.
- Is the head and shoulders pattern always accurate?
- No pattern is foolproof, and the head and shoulders can occasionally give false signals, especially in sideways markets.
You can follow my social platforms here.
To know more about our content please visit here.
500+ YouTube content. You can subscribe for more live content here.
2200+ Twitter Posting on live proof here.
Follow the Facebook page for updates.