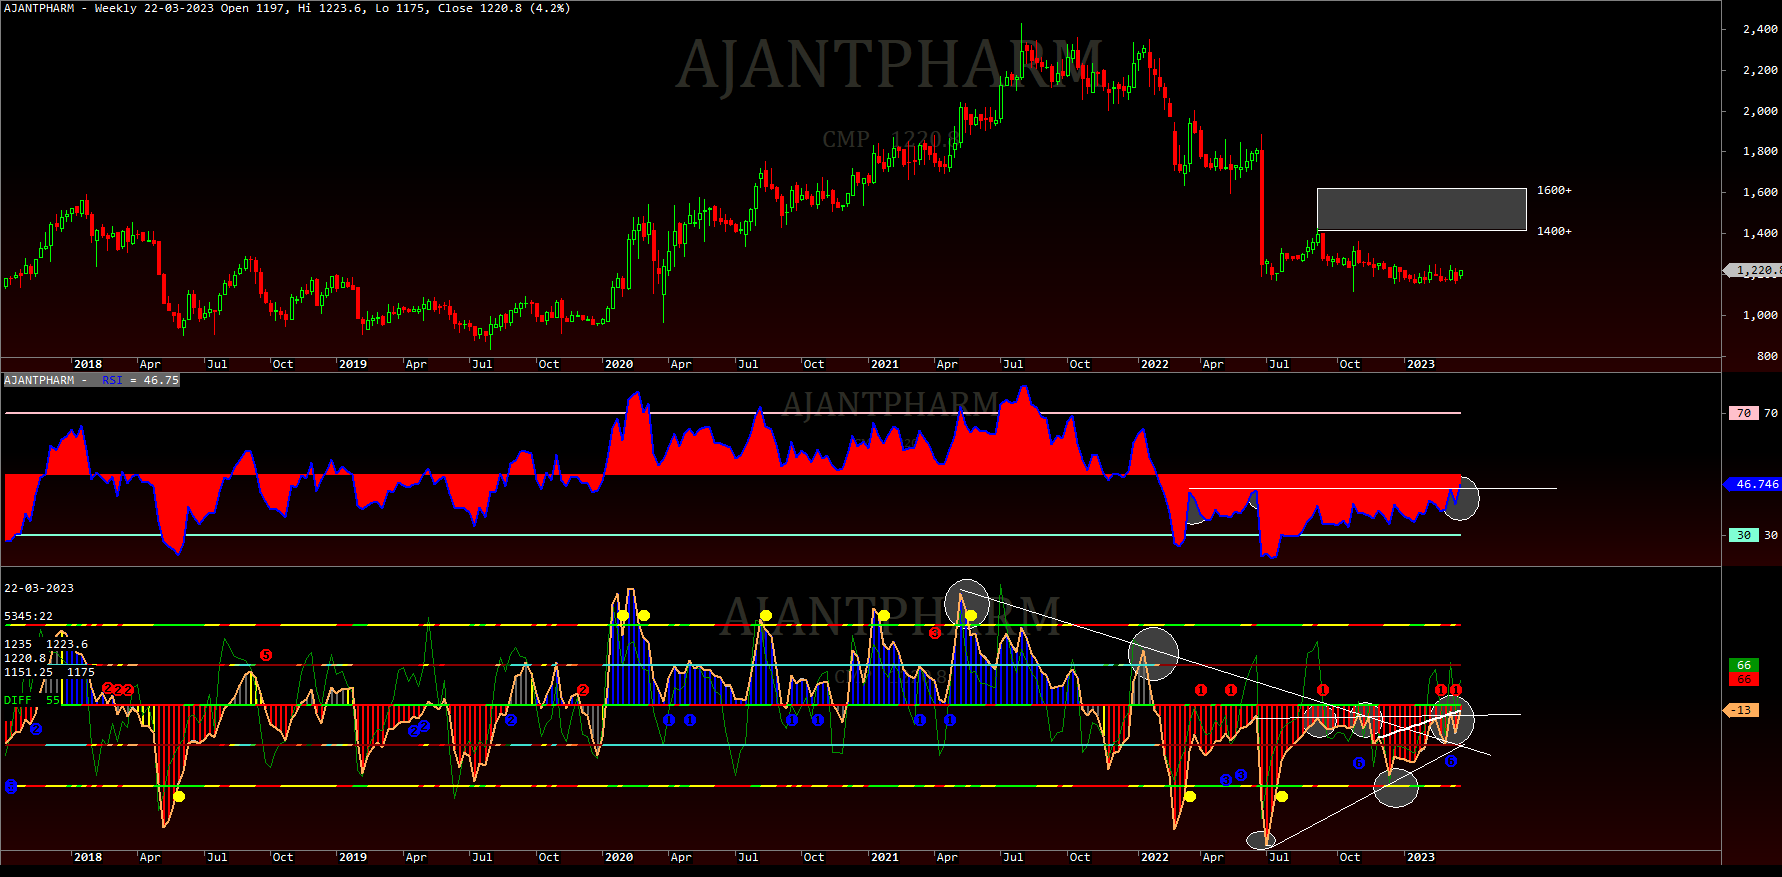
AJANTPHARM known as Ajanta Pharma Ltd. This Ajantapharma is a pharma-based company as mentioned in its name & the most aggressive company in this category.
About Ajantpharm
Ajantpharm is a multinational pharmaceutical company based in India for a long time. It has become a leading player in the pharmaceutical industry, particularly in the development, production, and marketing of specialty generic drugs.
Ajantpharm’s focus is on developing and manufacturing high-quality, affordable medicines in a wide range of therapeutic areas, including cardiovascular, dermatology, ophthalmology, oncology, and more.
Ajantpharm has a strong presence in both domestic and international markets, with exports to over 25 countries worldwide. The company has manufacturing facilities in India and Mauritius, and its products are sold in more than 40 countries through its distribution network.
In recent years, Ajantpharm has been recognized for its innovation and excellence in the pharmaceutical industry, receiving numerous awards for its products and operations. Ajantpharm’s commitment to quality and affordability has made it a trusted name in healthcare, both in India and globally.
Important Digit of Ajantpharm
| Market Cap | ₹ 15,628 Cr. |
| Stock P/E | 25.3 |
| ROCE | 29.2% |
| Book Value | ₹ 281 |
| ROE | 22.80% |
| High & Low (Yearly) | ₹ 1,428 / 1,062 |
| Face Value | ₹ 2.00 |
| Current Price (22/03/2023) | ₹ 1,230 |
For updated data, you can use this website.
Short / Mid-Term View
On a daily basis chart, we can see some range-bound level which is most promising for the next trend. For Short or Mid-term Ajantpharm stock has a good opportunity to trade. The range bound level is 1150 to 1240 area. So, a 5% to 10% move is justified for short-term or mid-term trade. Here also remarkable level is 1150 area is now acting as a major support area. If it’s a break then a small correction can possible till the 1130-1100 area. I will suggest the 1130 and 1100 areas which are acting as Supported areas, to add to your portfolio for a quick return. For more details about support and resistance, you can read this article.

For charts, you can use Tradingview.
Long-Term View
What Long-Term Investment stands for:
Long-term investment refers to a strategy where an individual or organization invests their money in an asset with the expectation of holding onto it for an extended or long time period, usually over several years or even decades.
The goal of long-term investment is to generate a regular income stream over time. The focus is on achieving a consistent and reliable return on investment over the long term rather than short-term gains.
Long-Term: Ajantapharma
I am using a weekly time frame chart for a long-term view. Here, on Ajantapharma I am using a weekly time frame chart where you can see the price along with two major indicators. One is mostly famous RSI and the other is the Woodies CCI panel. On RSI panel it shows the breakout level from the downside which is mostly a positive sign for the long run. From the bottom breakout zone, we can accumulate it. As I said in my Short-Term view the 1130-1100 area is good for the accumulation zone. You can add this stock to your portfolio list at this range. Another indicator i.e. Woodies CCI is also a sign of investment at this level. CCI shows a divergence that is positive against the price trend. CCI breakout from the bottom and divergence both are the most positive signs for long-term investment. If fail to hold the 1100 level then the next support is near the 1000 area which is 10% down from the 1100 level.

Fundamentally, this stock is good, and if have any chance to add your portfolio to SIP module then this will be a great output after a healthy time like 20 or 30 years. So, go ahead and try to understand the value of an investment from long-term view.
Investment Disclaimer:
The information provided on this platform or any related communication channels is for general informational purposes only and should not be construed as investment advice. The content should not be relied upon or used as the sole basis for making investment decisions. Any reliance on the information provided is at your own risk. We do not make any representations or warranties as to the accuracy or completeness of the information provided on this platform. We disclaim all liability for any loss or damage arising from reliance on such information. Investing involves risks, including the potential for loss of principal. Past performance is not a guarantee of future results. Before making any investment decisions, you should seek the advice of a qualified professional. We may have positions in the securities mentioned on this platform or any related communication channels. We may also receive compensation for promoting certain products or services. Any opinions expressed on this platform are subject to change without notice. By accessing this platform or any related communication channels, you agree to the terms of this investment disclaimer.


