MA with Woodies CCI Strategy in 2023 will be the best trick for all intraday traders. Moving average (MA) is the most common instrument for any technical analyst. MA (Moving Average) with Woodies CCI Strategy will be the most usable formula for those who are preferred to do paper trading. I, always use the moving average as a trending finder, not for trade. If you want to improve your intraday trading skill then you have to include some supporting instruments for better and clean confirmation. Our first moto is to avoid or filter out the sideway market and catch the breakout or breakdown zone before its’ blast. Here I am going to elaborate on some tricks to catch the price at the proper time and exit on the safe side. MA with Woodies CCI Strategy in 2023 risk ratio management will be very clear and you will understand the tricks very easily.
Chart Platform
Here I suggest you use tradingview platform. This is free and you can get some extra access to Indicators. All types of custom indicators are there and you can also develop your own indicators with coding. If you are using some premium platform like MT4, MT5, Amibroker, etc. then you can also access the same. Those who are using Zerodha, Upstox, Dhan, etc. platform you can also get the same but it will be a little bit complicated.
Why MA with Woodies CCI Strategy
The MA with Woodies CCI Strategy strategy is a popular trading technique used by many traders in the market. It is based on the Commodity Channel Index (CCI), a technical indicator that measures the difference between an asset’s current price and its moving average. To use this strategy, traders typically look for CCI patterns that indicate a bullish or bearish trend. These patterns are identified by looking for divergences between the CCI and the price of the asset being traded. Those who use the Woodies CCI strategy often combine it with other technical indicators, such as the Moving Average (MA), to increase their chances of success. They also use stop-loss orders to limit their losses in case the market moves against them. Overall, the Woodies CCI strategy is a useful tool for traders who want to make informed decisions based on technical analysis. By understanding how the CCI works and combining it with other indicators, traders can increase their chances of success in the market.
Using Indicators / Instruments
I am using 3 (three) major instruments for this MA with Woodies CCI Strategy. I hope this will increase your trading skill also. These are the 3 instruments with their parameters as follows.
Woodies CCI Indicator –
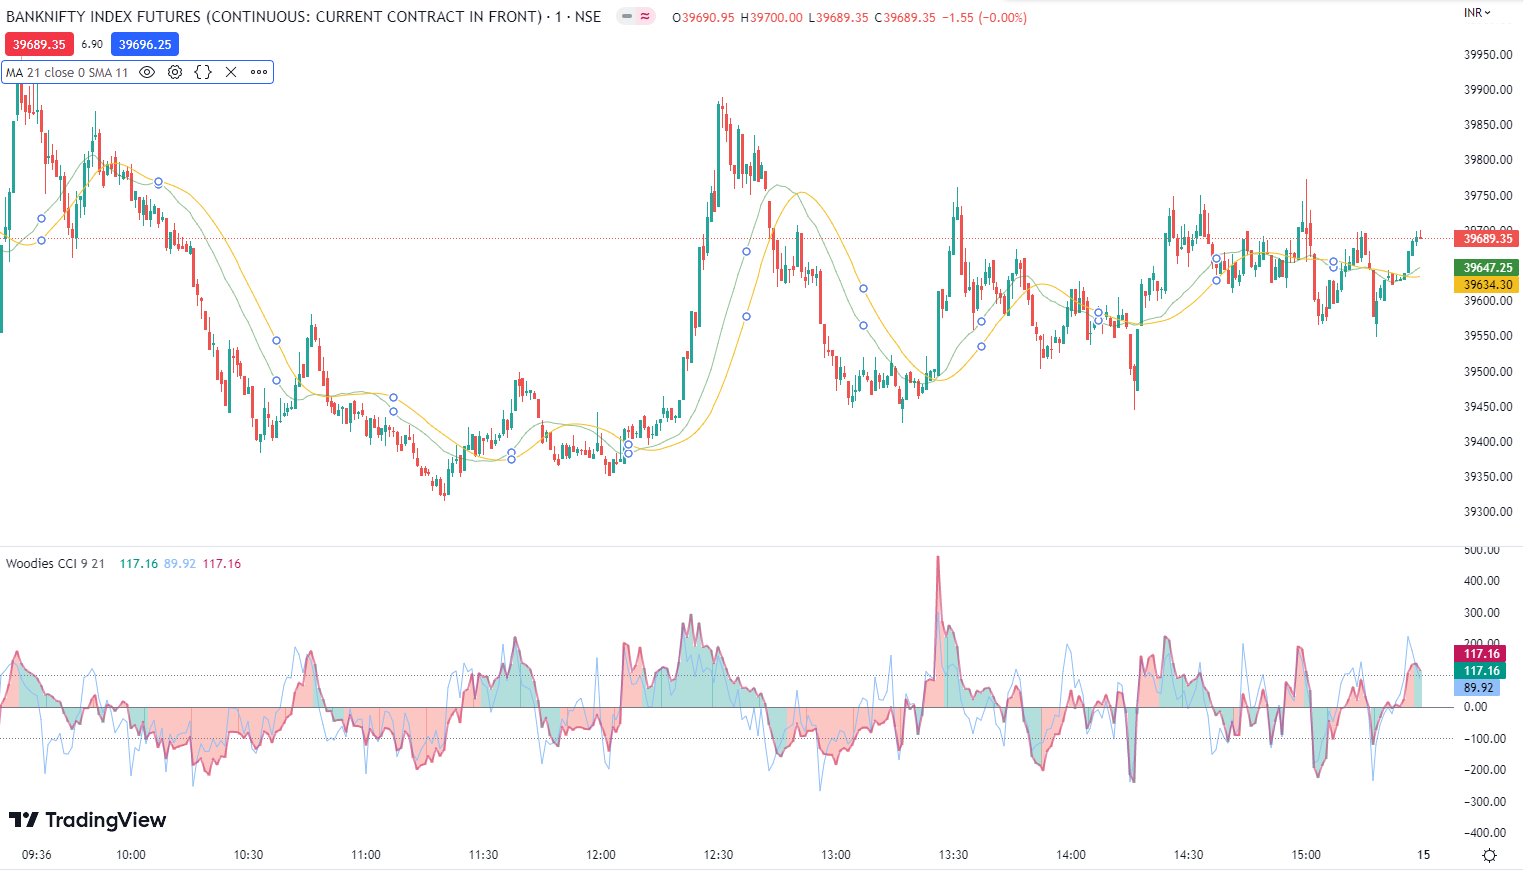
Here I am using woodies CCI for MA with Woodies CCI Strategy. This is not for any complicated view. This is only for counting candles. During the explanation, we will discuss how to use this indicator and how to use CCI indicators instead of woodies also. In this trick, I am using CCI value 21 and TCCI 9 for reference.
Moving Average –
Using the instrument for better understanding the trend on MA with Woodies CCI Strategy. This is also very much important for your trade where any crossover against the trend will be the execution value if CCI follows the positive rules. Will explain all the tricks in detail. In this trick, I am using MA (Moving Average) value 21 for reference.
Simple Moving Average –
Using the instrument for better understanding the execution related to moving average. This is also very much important for your trade where any crossover with MA against the trend will be the execution value if CCI follows the positive rules. Will explain all the tricks in detail. In this trick, I am using SMA (Simple Moving Average) value 11 for reference. For MA with Woodies CCI Strategy, this SMA is a very much important instrument along with others.
Setup on TradingView –
As I said earlier, I prefer tradingview for real-time trading. This has much more options with this free version. Open tradingview site and log in with your user id and password. This is absolutely free if you do not yet register. Now open Chart for MA with Woodies CCI Strategy.
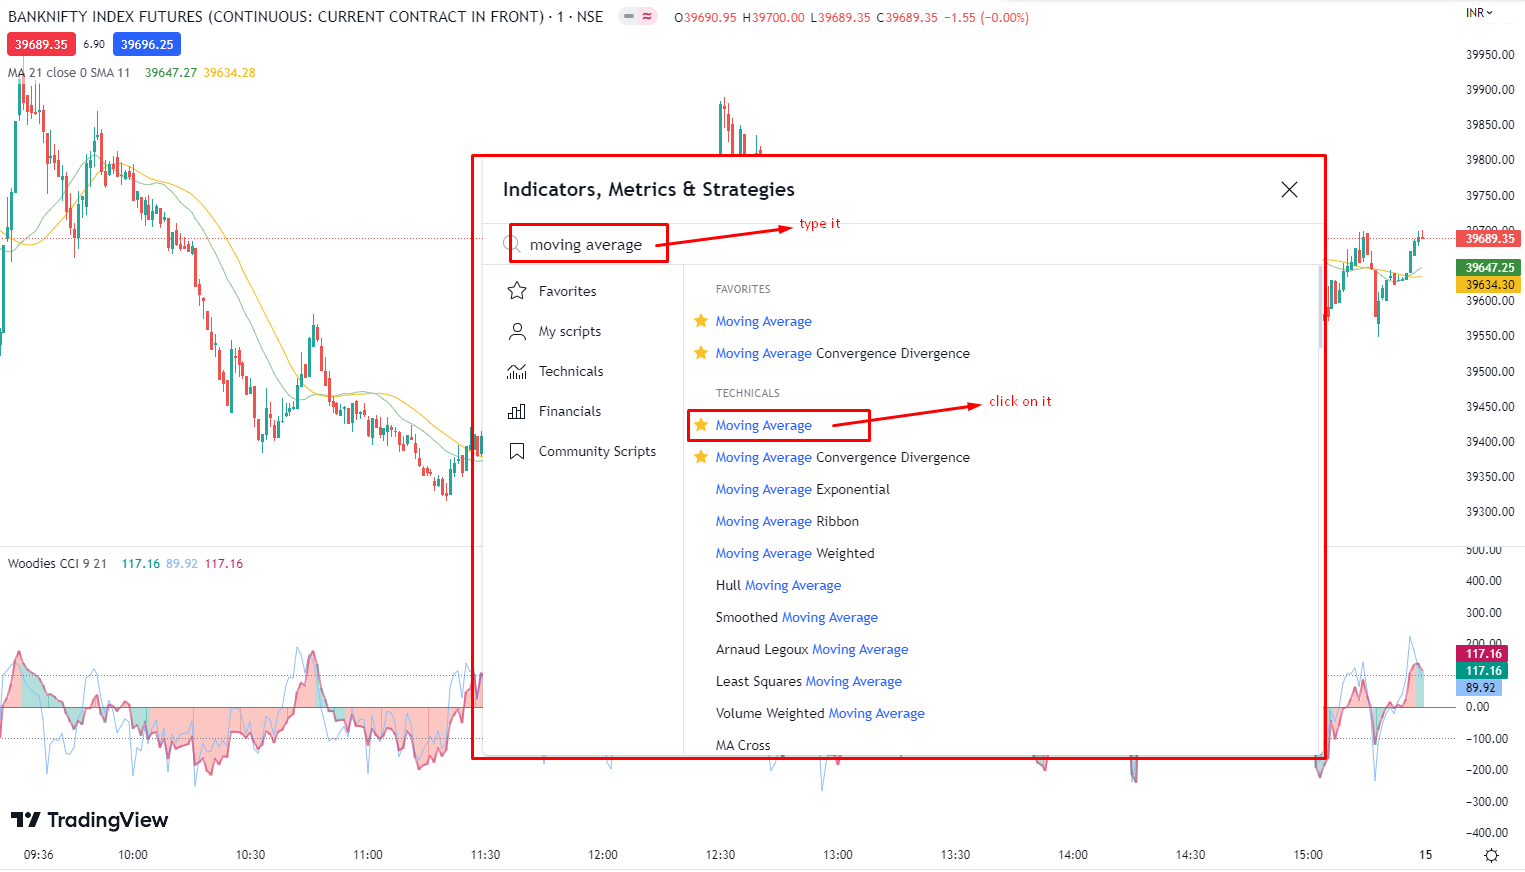
In the top middle area of this chart, you can see the “Indicators” tab. Just click on it. You will see a search pop-up tab named “Indicators, Metrics & Strategies”.
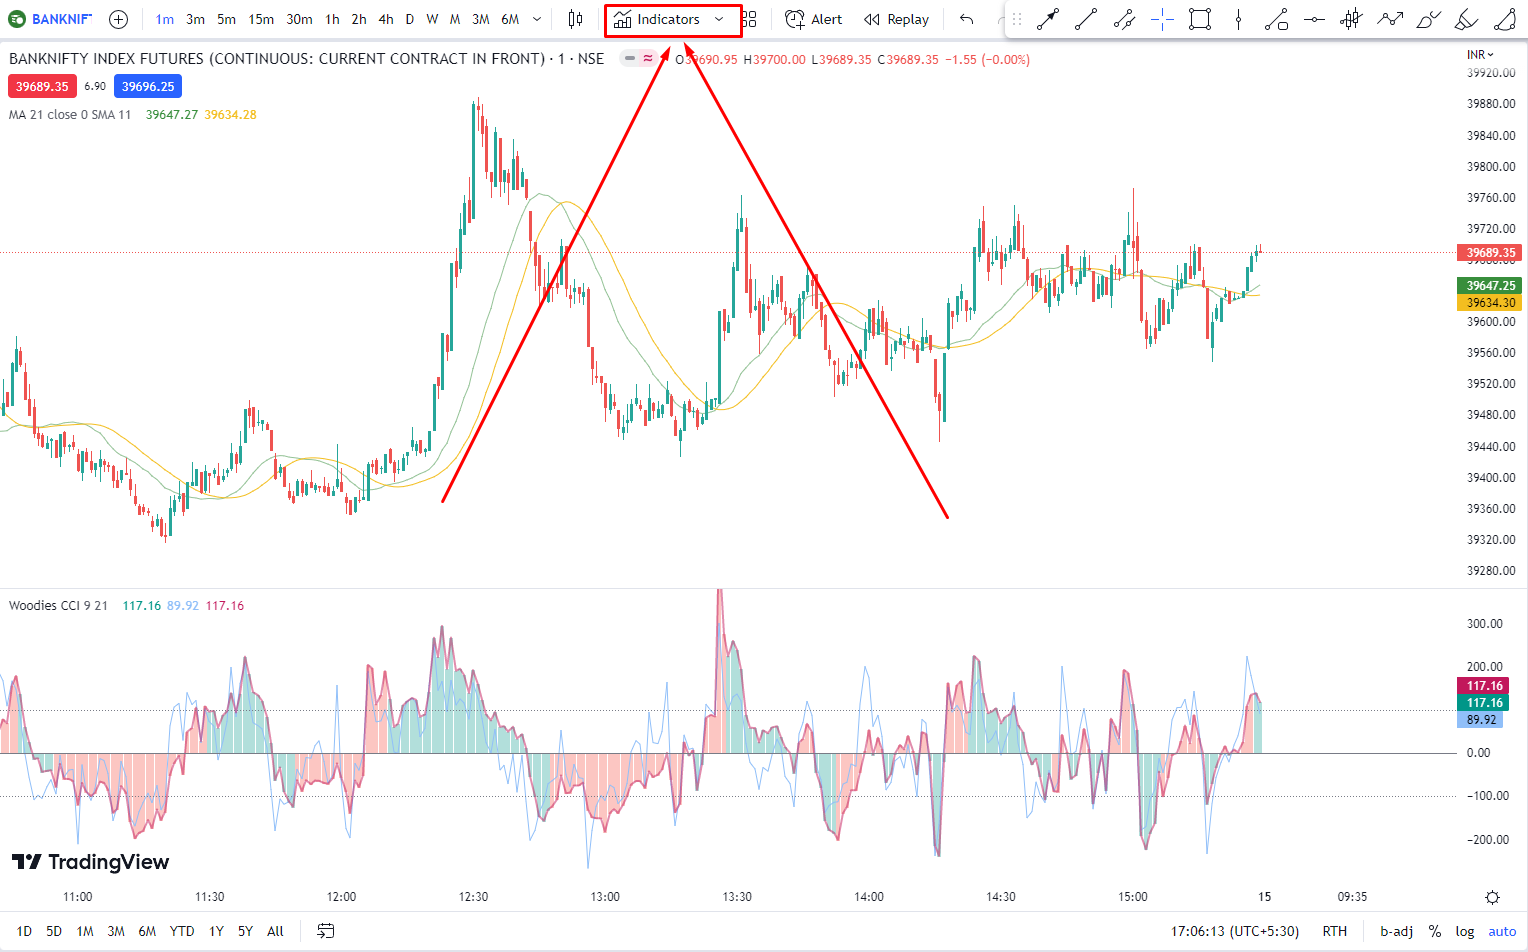
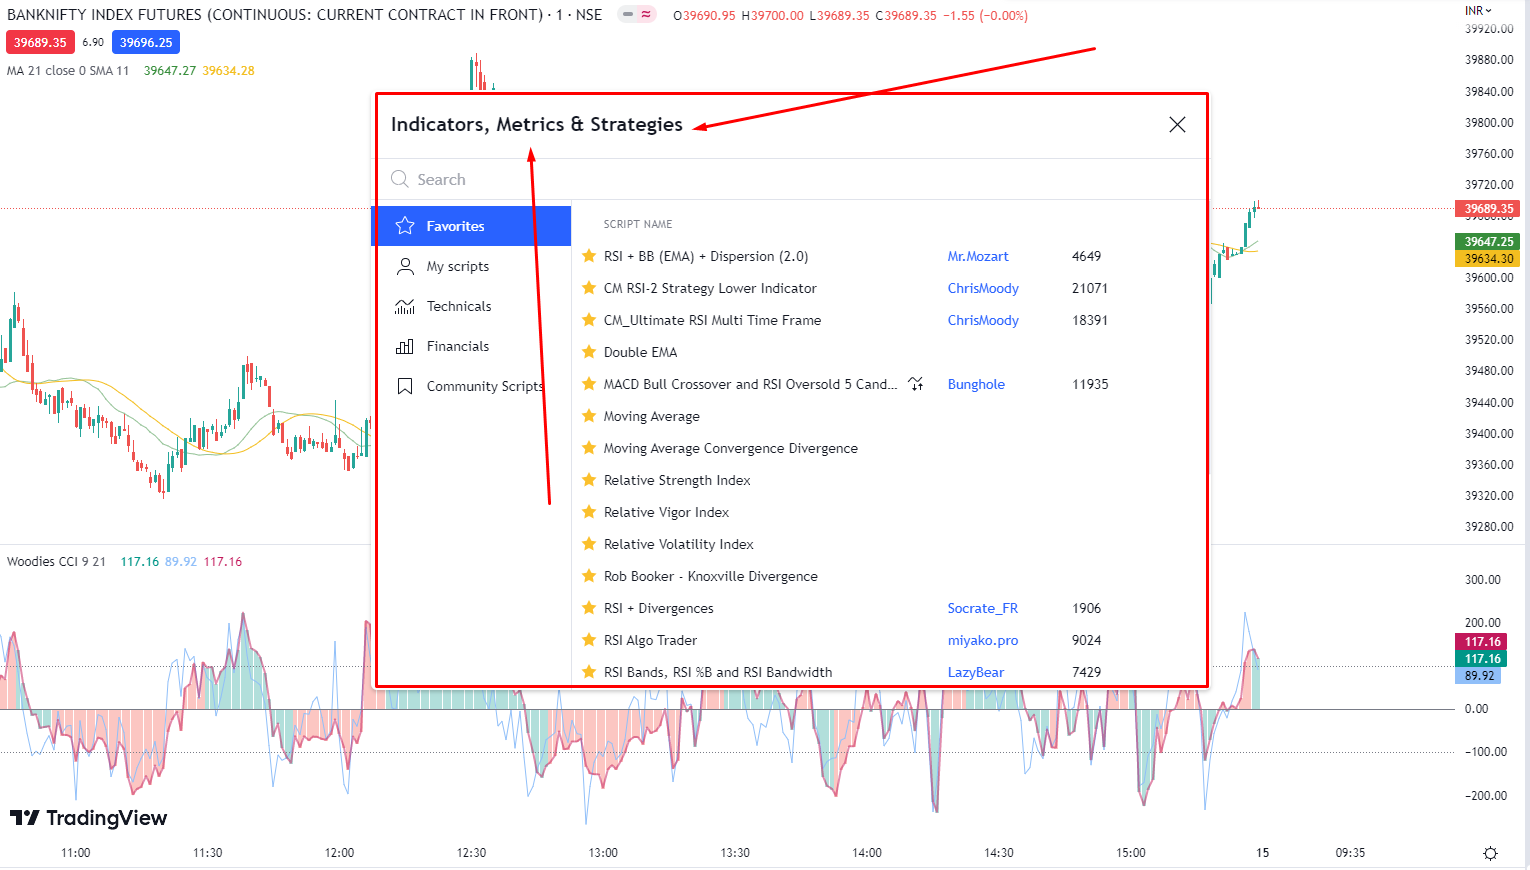
Here we go. Search your desired indicators or any instruments that you want to add to your trading chart. Here we will search 1st one is “Woodies CCI”.
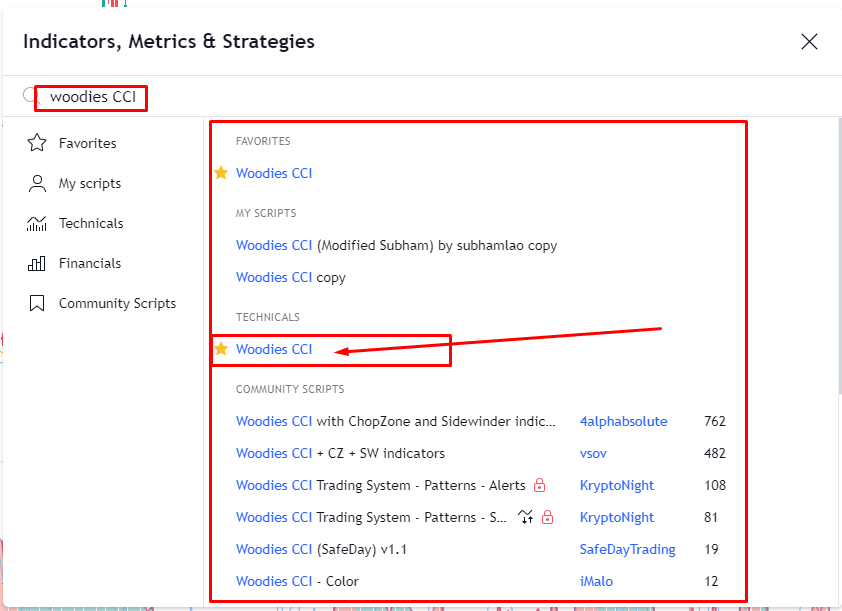
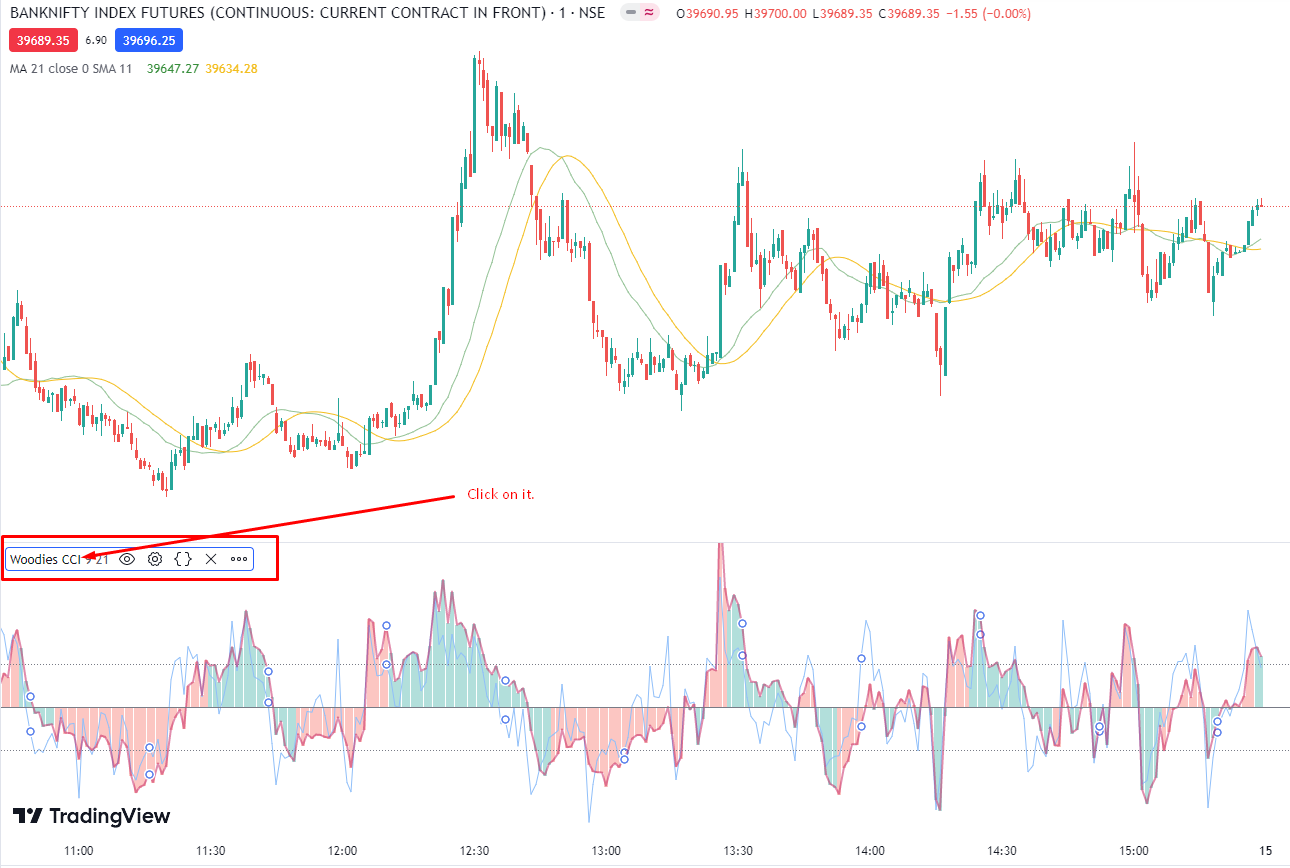
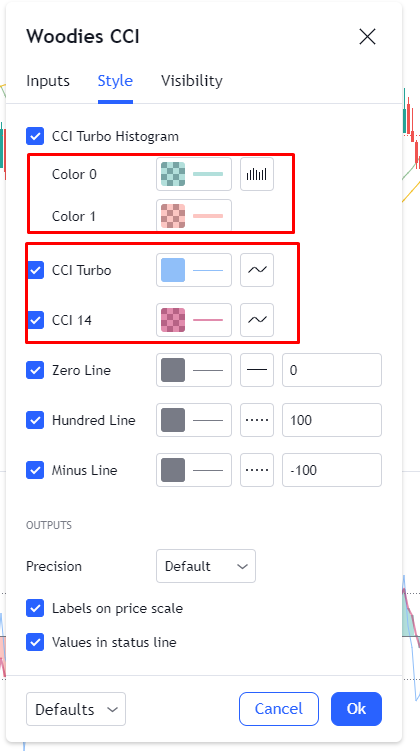
You will see lots of results. I prefer only “Woodies CCI” which is simple and required for this trick. You can also other variants, but the target is to count the bar which I will explain later. After clicking this indicator, it will appear on your chart on the bottom side. Here you have the change the parameter as I said earlier. The CCI will be 21 and TCCI will be 9. You can use the bold line for better looks. This is the most important step for MA with Woodies CCI Strategy.

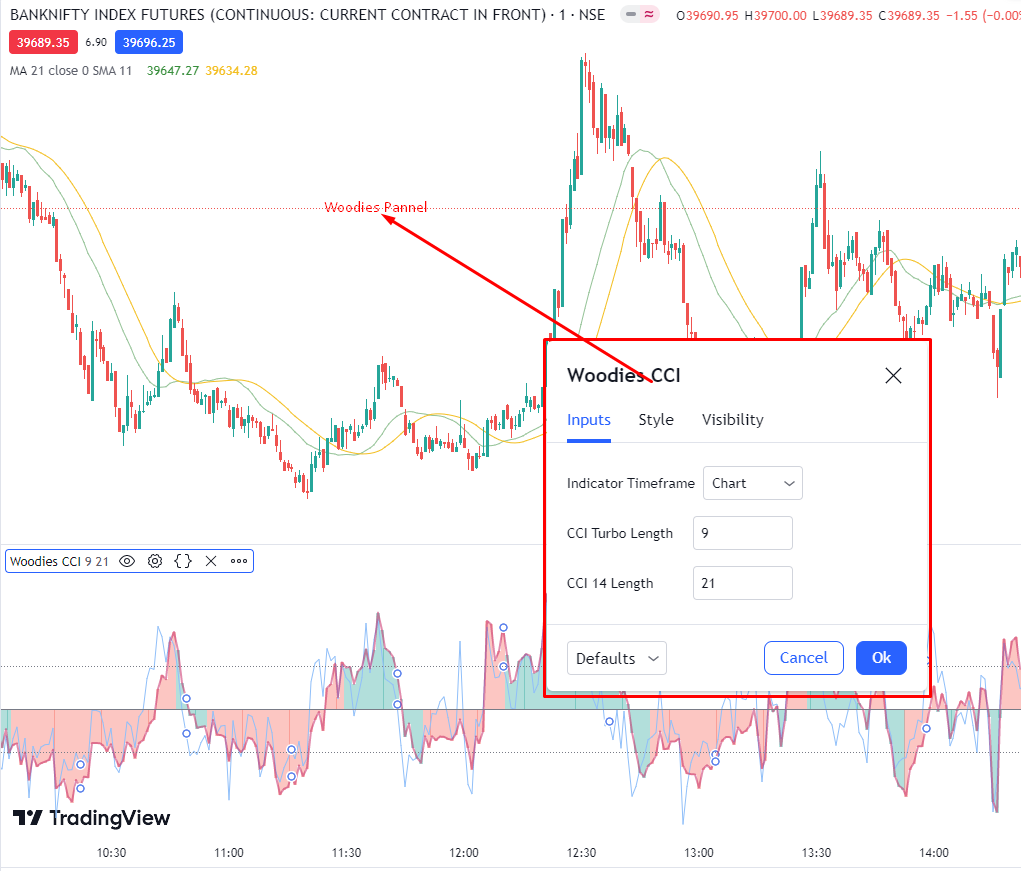
Change the value here as stated. On “input” tab you can see the CCI length which will be 21 and CCI Turbo length 9. You can change the color and line depth for a better looking and understanding.
Here all done for woodies CCI setup. Now we can see this type of output after changing the parameters of CCI value.

Now we have to set up the Moving Average and Simple Moving Average instruments on the chart which is very much simple. All you have to do is the same exercise to search the indicators as you already search the “woodies CCI” indicator. On clicking “Indicators” panel you have to type “moving average”. And click on it to add the same to your chart.
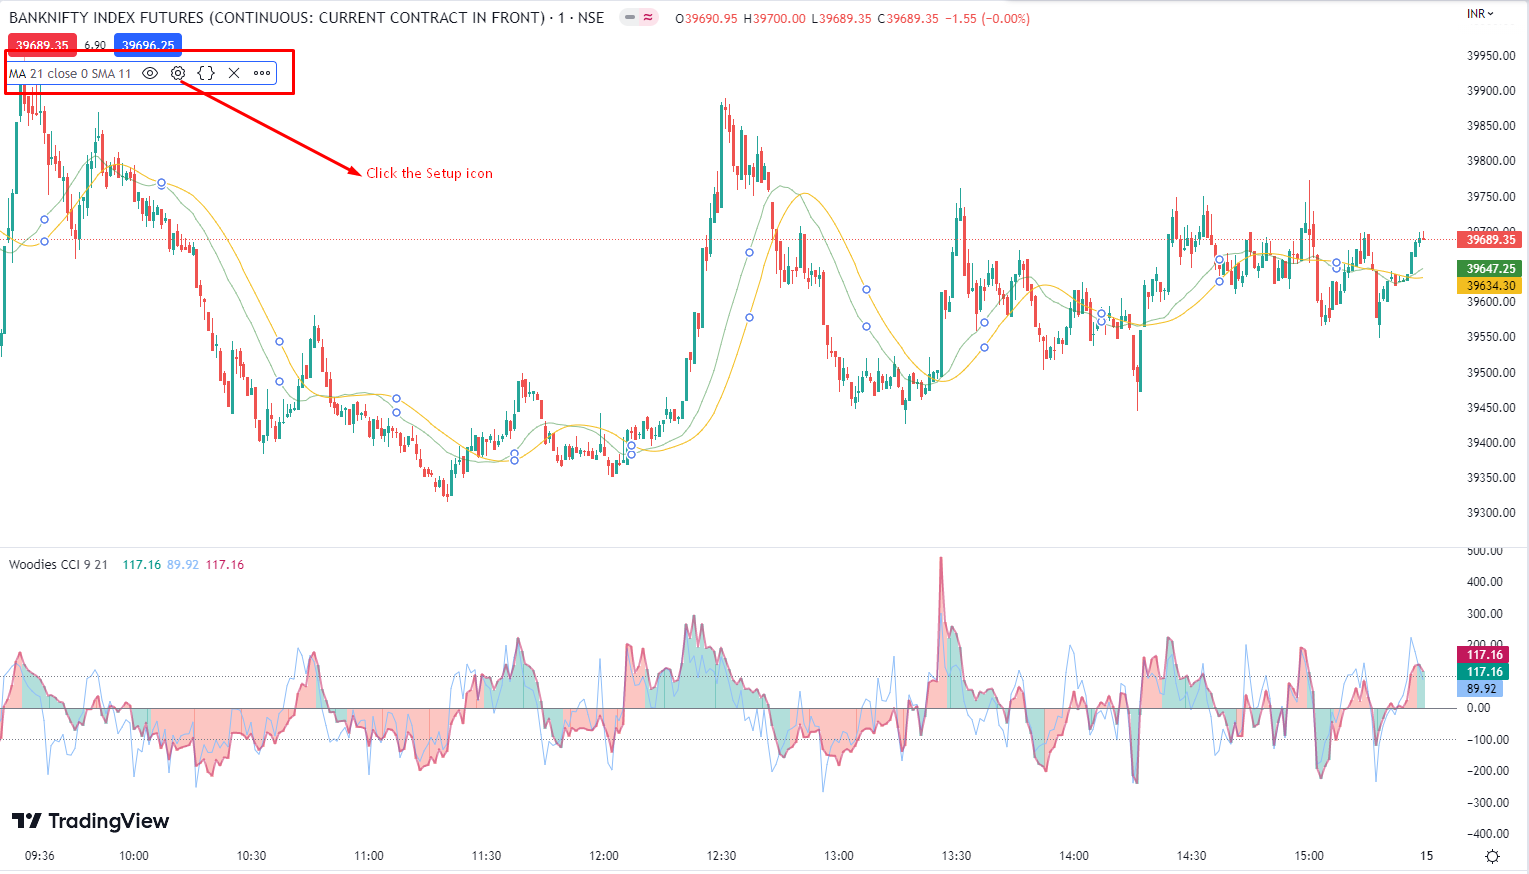
Clicking on Setup icon you will see a pop-up panel where you will find Moving average value input area and below the panel you also find the SMA (Simple Moving Average) value entry area. Just input the value of 21 against the MA and 11 for SMA.
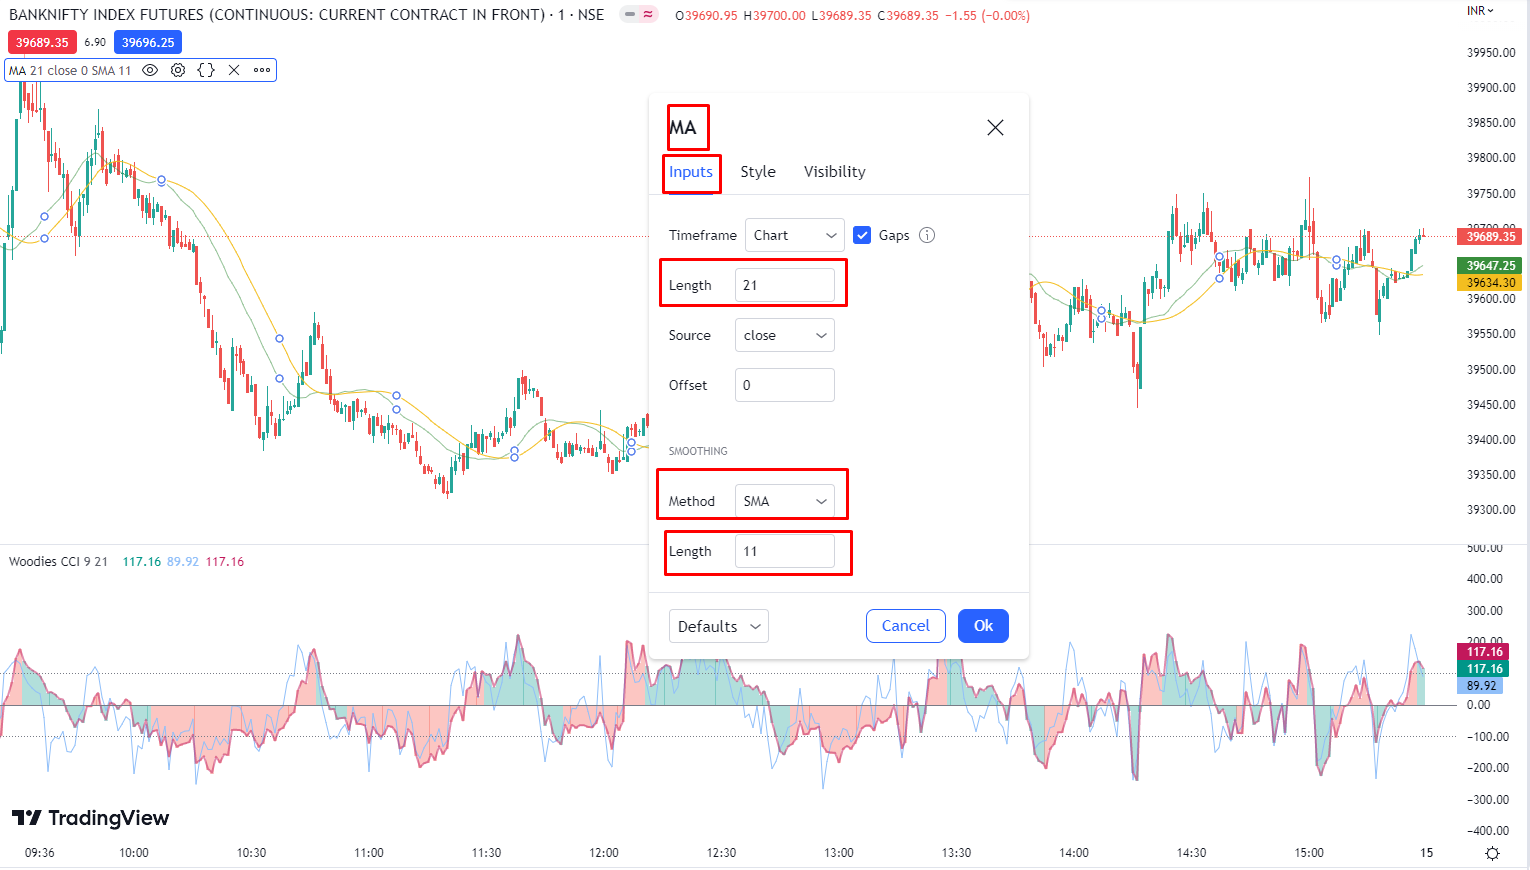
Now click on “OK“. All set. Now your setup is completely done for the trading trick. Always remember that, if you do not log in to the tradingview platform then the full setup will be not saved. Again you have to set up the full exercise. If you registered on this platform then it will save the changes on regular basis.
If you are interested to start your investment plan in 2023 then you can go through this article for a better understanding.
The Strategy Rules –
MA with Woodies CCI Strategy in 2023 will be a very good strategy if you scalping your trade. Here we are using 3 minute chart time frame for this trading. You can use 1-minute chart time frame. But 1 minute chart time frame will be noisy.
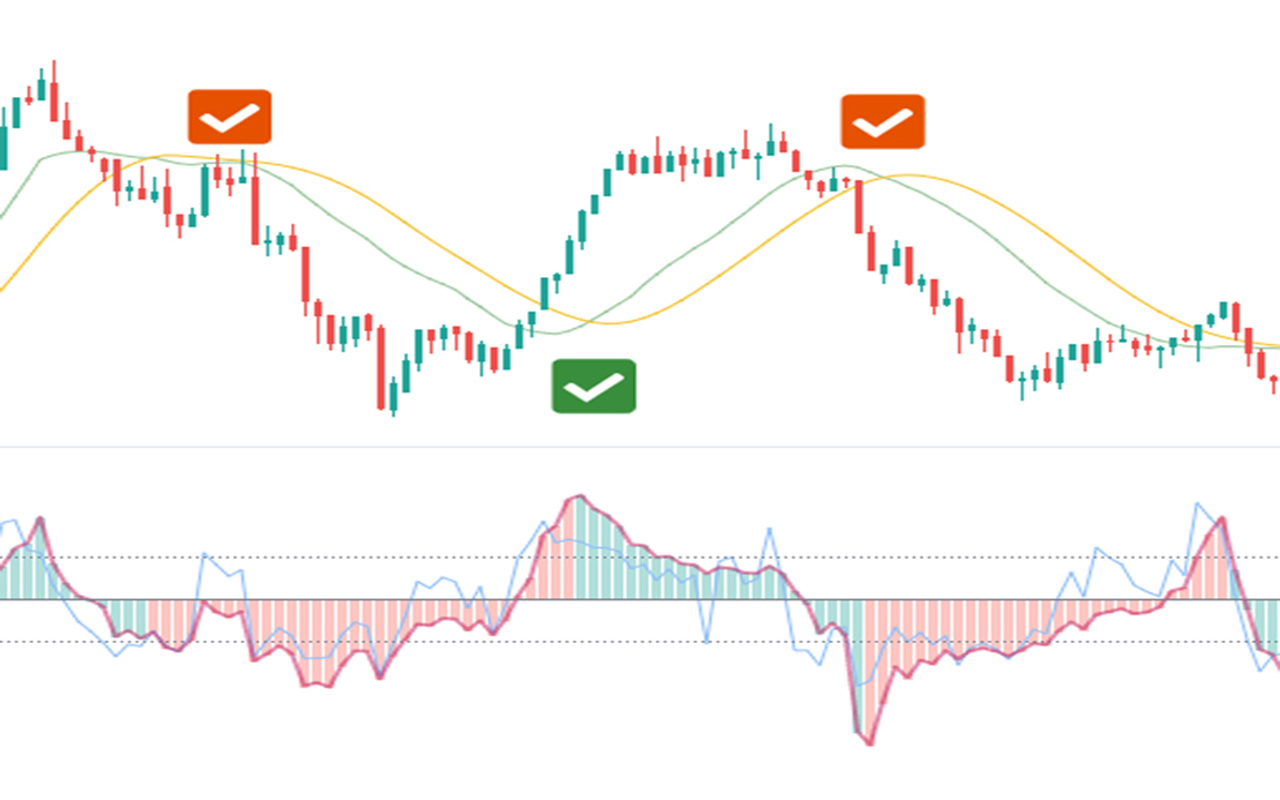
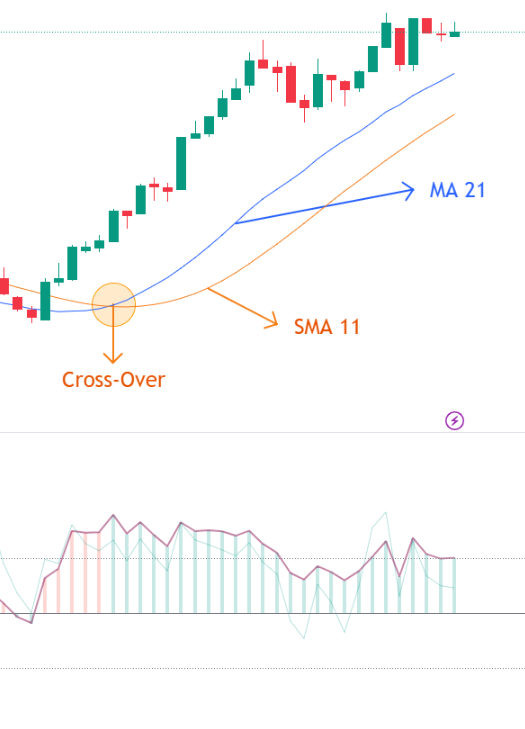
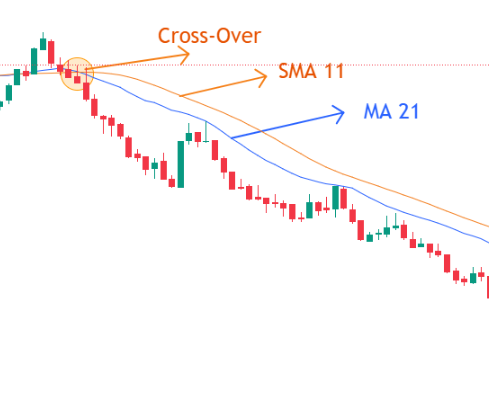
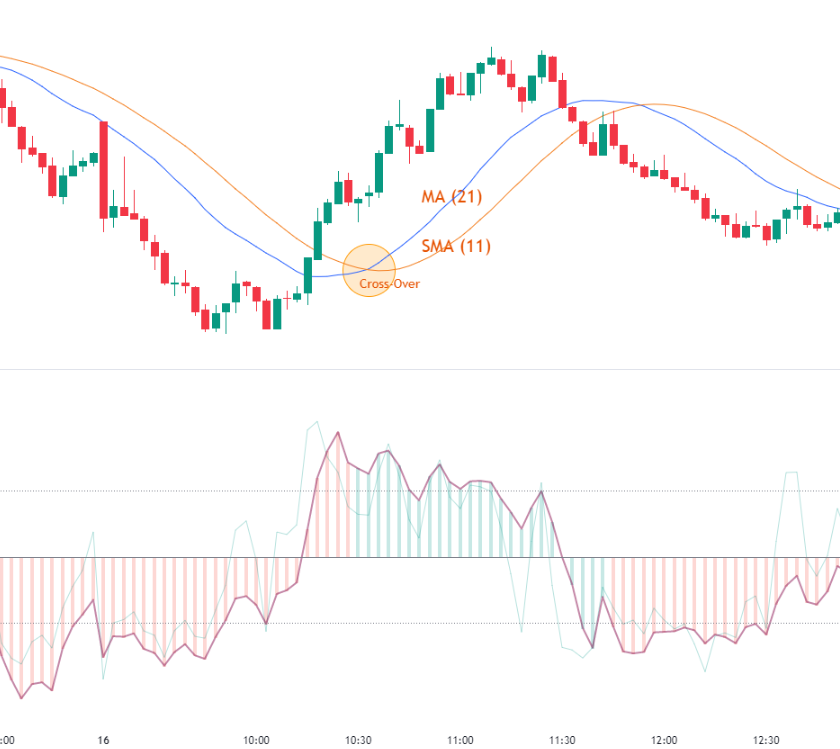
Negative zone CCI activities with MA & SMA crossing means, it is indicating the Selling or Short side trend. Another way is if MA crosses the SMA line with a situation of MA above the SMA line that means it’s a buy or positive trend. Otherside after crossover both (MA & SMA), topside SMA running and next to bottom MA running is indicating the selling or negative trend.
1st, understand the validity of Woodies CCI. Always avoid 1st 5 candles from the zero line. Any side from zero to 5 bars/candles has to avoid the trade. No matter the spike candle or anything.
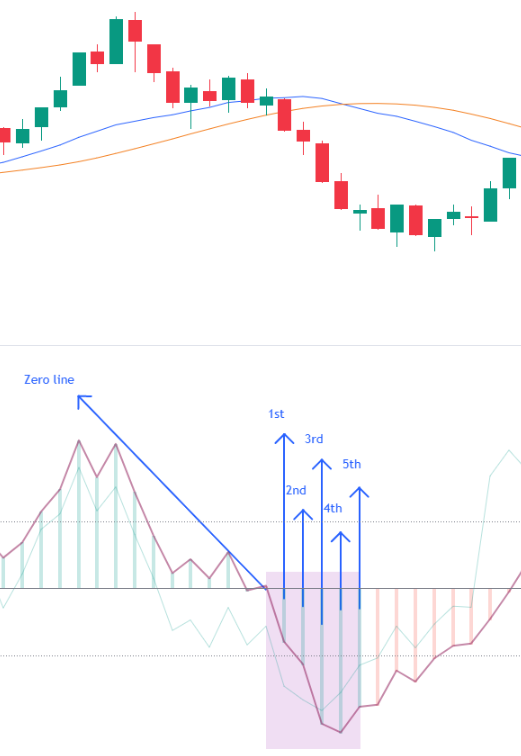
If any crossover between MA 21 & SMA 11, happens among the 5th bar of the CCI, then avoid the trade.
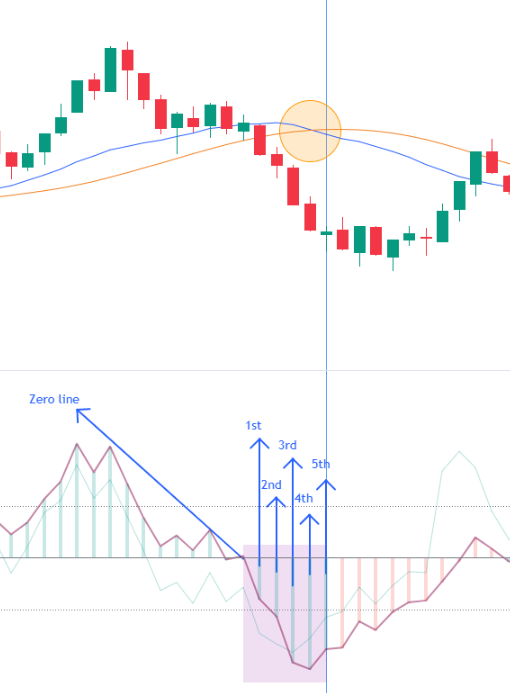
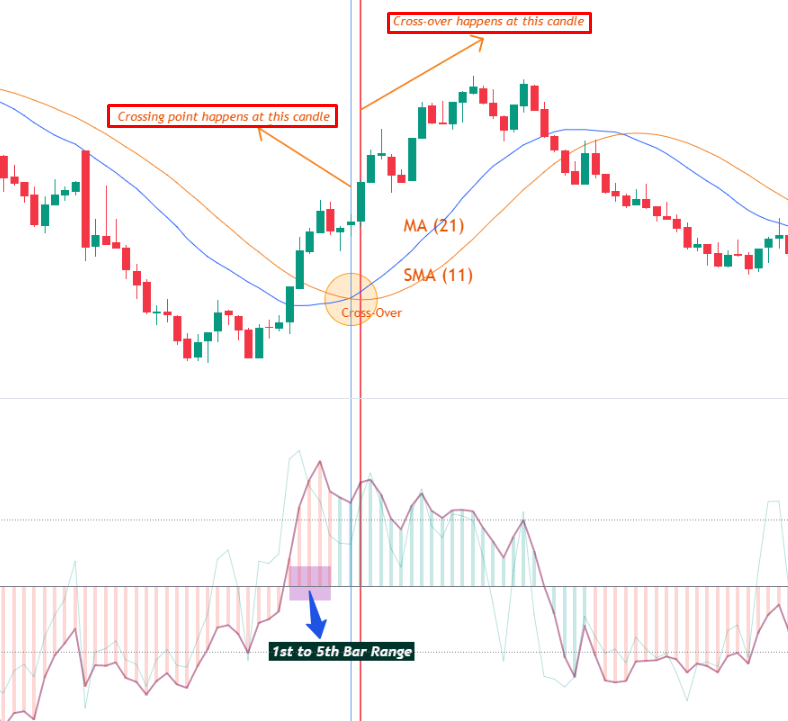
In the above chart, you can see that the crossover happens on the 4th bar. A complete crossover happens on the 5th bar. Our rule is to avoid the trade if the crossover happens in a range of zero on the fifth bar.
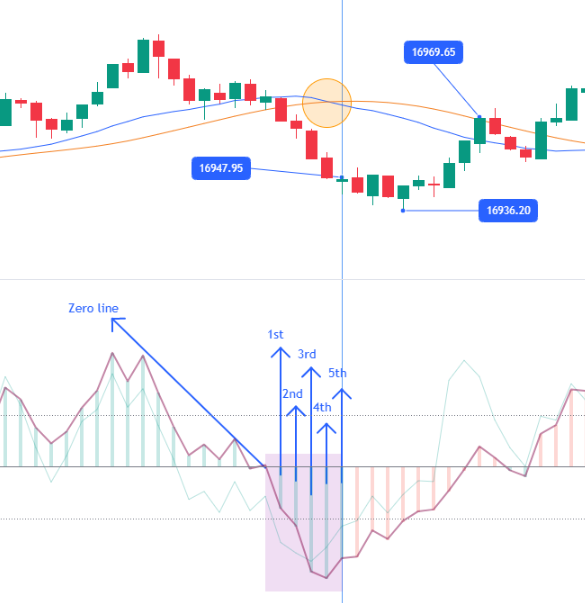
Here you can see, if you take an entry with only crossover rules then trade happened at 16947 area, low made at 16936 area, and then stop loss taken 16969 area. This means you save 22 points for this CCI condition.
Now one question is in your mind at this level that I realize why I mentioned 16969 as a stop loss. What are the Stop loss rules? Everyone wants to check out the profit figure first. But this is a bad habit. The first priority is always pointing out the avoid rules and the stop loss rules. This can save you money for the next trading limit. The stop loss will be the complete crossover of CCI on the zero line which makes sense for changing the trend. Here 16969 is the crossover closing price. But this is not a valid trade. Here I am not using any TCCI activities on this trade or trading.
Now we have two major rules (Which can save your money)
- Avoid the trade which is based on crossover against the Woodies CCI
- Stop loss based on crossover on zero line of Woodies CCI.
Buy Sell Rules
The best way for MA with Woodies CCI Strategy is to use your basic knowledge. Do not think so much complicated. I am using 3 minutes chart time frame for this tade.
1st look – Crossover of MA & SMA. (wait for Complete crossover)
2nd look – Check the Woodies’ CCI position. We have to watch 6th bar to 9th bar area. If crossover happens between the range of 6th to 9th bar, then you can go for trade as per the crossing condition. Check the real photos for reference.

For the Sell rule, we use the same type of application to execute the order. Always keep in mind that use your trading candle after the time frame candle.
Exit and Stop loss Rules
We can always use our exit rules with time-based calculations. If you are using 3 minutes time frame chart then my best suggestion is to book your profit from 0.06% to 0.09% or 0.10%. This will give you a simple range of trading. Multiple trades can possible.
For stop loss, you can use the last spike low or high for your trade
This is the MA with Woodies CCI Strategy for 2023. Keep enjoying the trading tricks. Please consult your expert before making any trade.